Hi.
I've been playing around with ELK for about a week now and I'm starting to get the hang of it. But I'm struggling to visualize what I want in Kibana. I have around 500 servers/devices that I want to monitor. They can be categorized into around 15 types of servers.
One of the servers is gathering information and logging it through Logstash and into Elastic and Kibana 4.
I want to create two visualizations (lets focus on the first one):
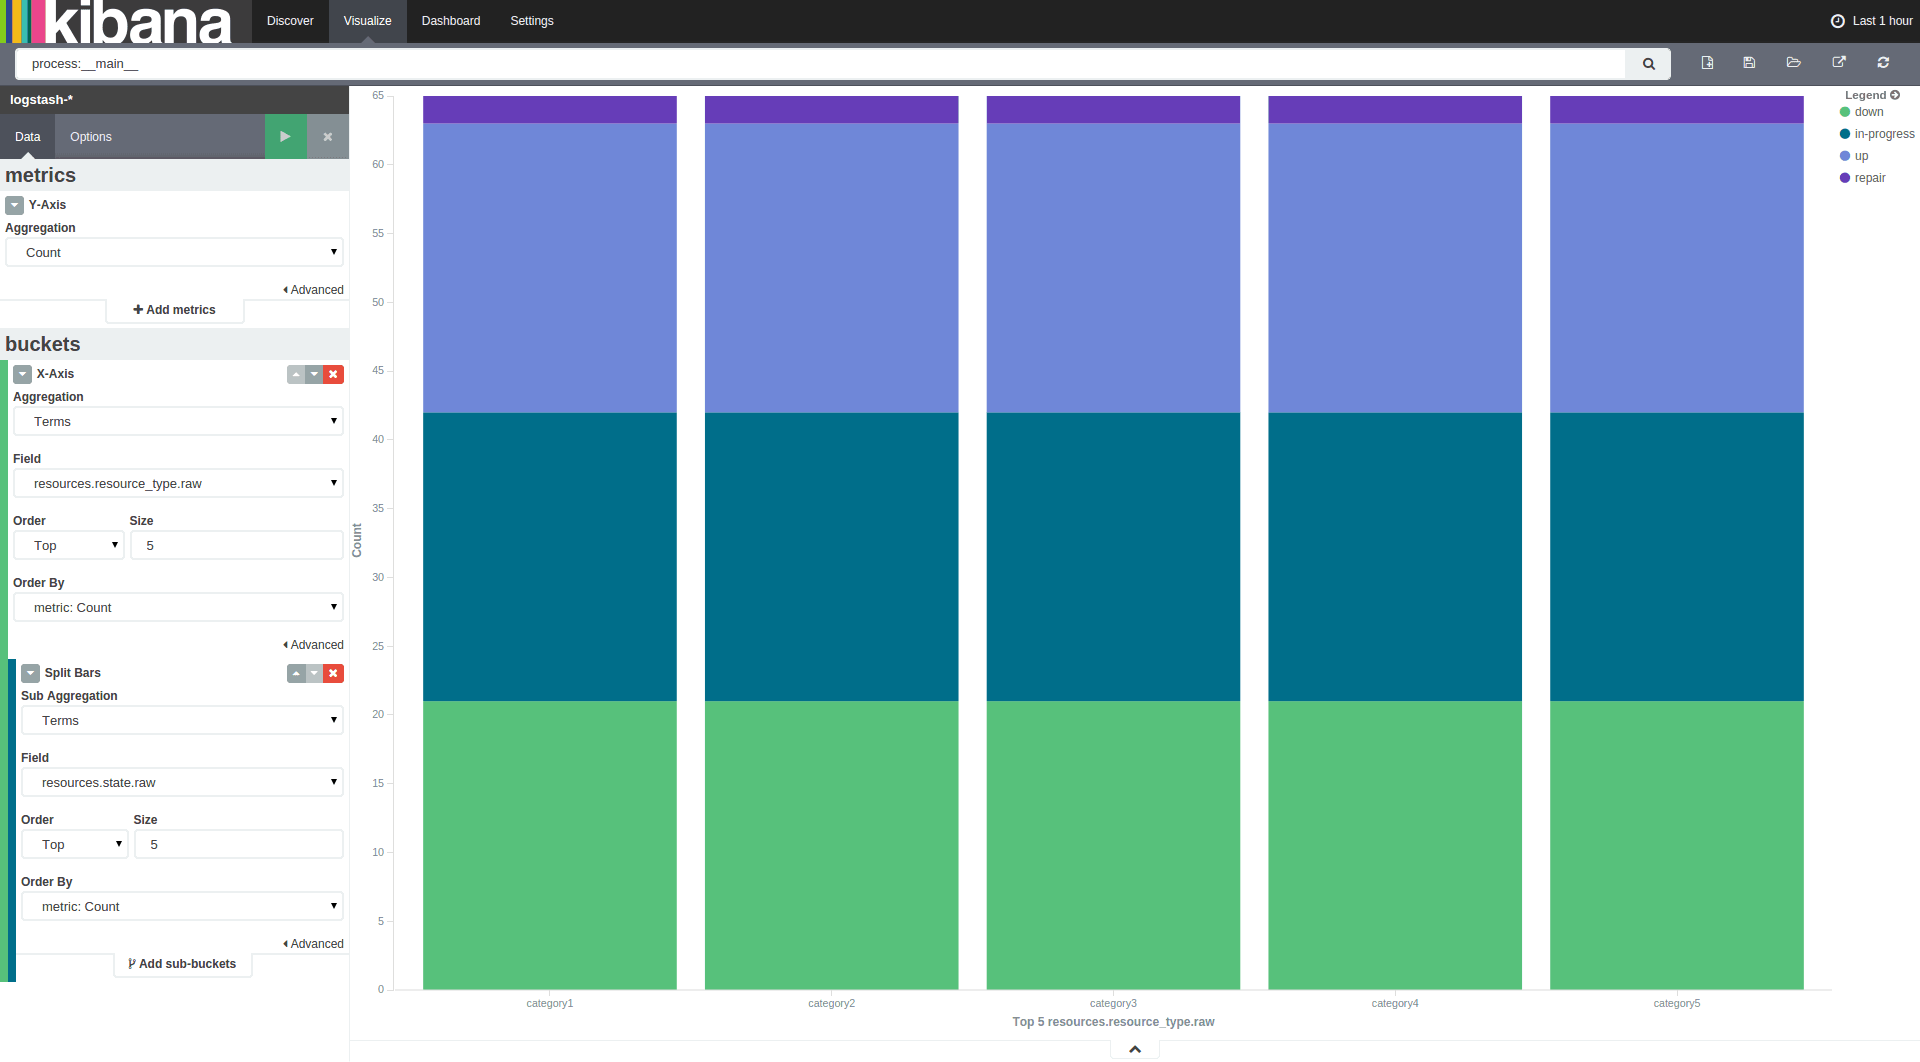
- A bar chart, where the x-axis is top 5 terms in server-types, y-axis is the number of servers in this category and the bar is split into the different statuses (up/down/repair/etc).
- An area chart over time with percentage of the servers being up/down/etc. graphed.
I'm not sure what the best way to report the data is, but this is what I currently have:
Every x-minutes a server checks all the servers and logs a line similar to this:
-timestamp- -prefix- {'resources': '[{"current_sw_md5": null, "hostname": "hostname1", "state": "down", "resource_type": "category3", "mac_address": null, "last_checked": "2015-07-27T15:28:29.246672"}, {"current_sw_md5": null, "hostname": "hostname97", "state": "up", "resource_type": "category1", "mac_address": null, "last_checked": "2015-07-27T15:39:05.273286"}, {"current_sw_md5": null, "hostname": "hostname92", "state": "up", "resource_type": "category1", "mac_address": null, "last_checked": "2015-07-27T15:39:09.011632"}, ...]}
This is what I managed to visualize, I cant get the bars to be the correct height or split up correctly. What am I doing wrong? Any tips or good examples I can look at?