Apologies if posted elsewhere but I searched and didn't find anything. I am testing with Visual Builder which I know is Experimental. I am not sure if this is on my data-input, or just a byproduct of Visual Builder.
I have a time-series flow of data (Netflow data) but the 'max' values shown differ based on my time period selection.
In the attached screen shots, we see that @24hrs, the spike shows 142KB/s.

But when I zoom in on it, it now shows that spike as 274KB/s.

And zoom in MORE, it now shows a value of 2.6MB/s..
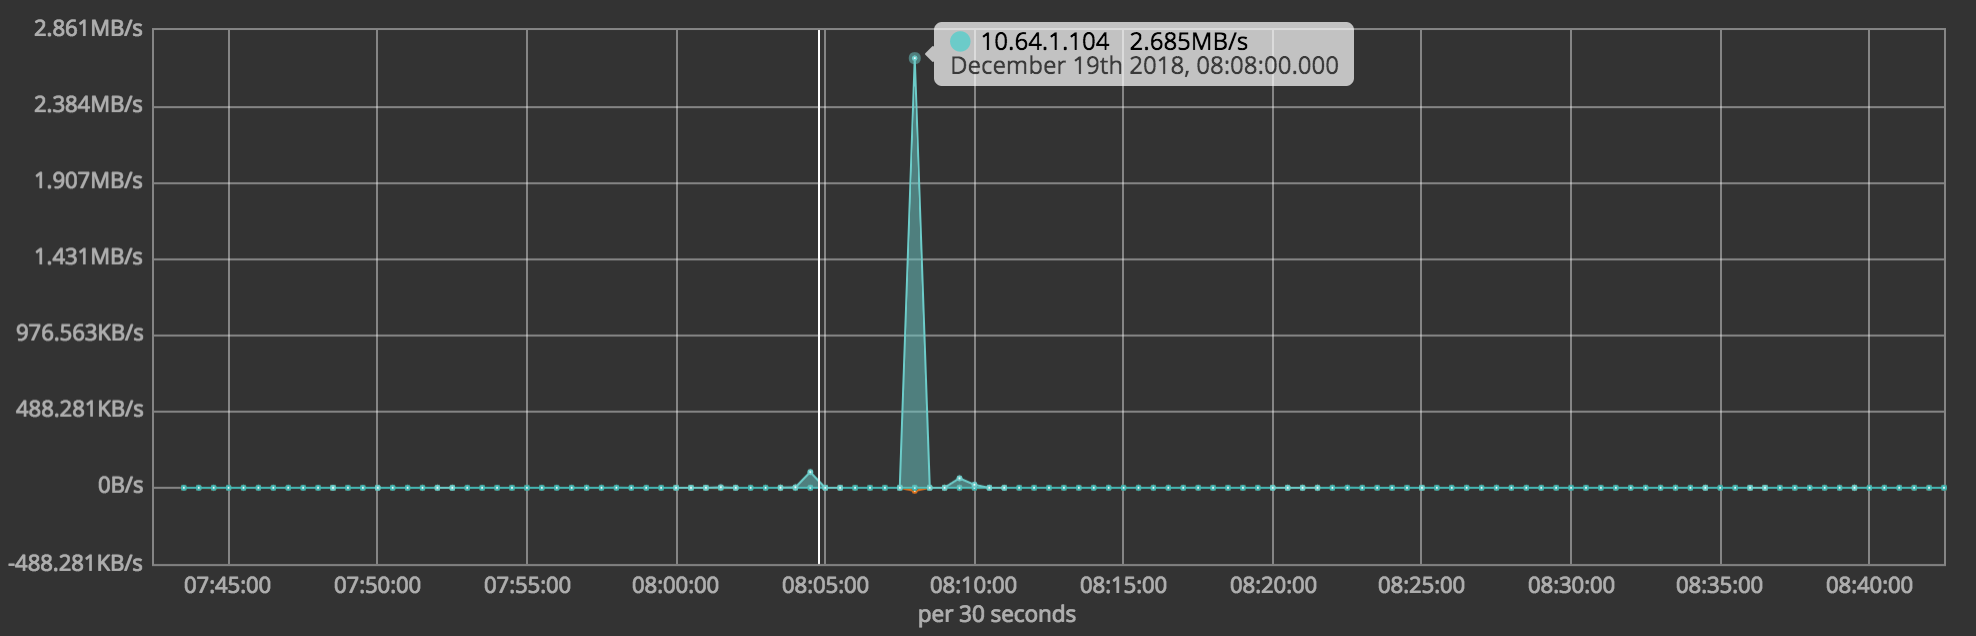
Shouldn't the Maximum always be the maximum regardless of my zoom view?
Thanks!