We have multiple clients. Each client has there own instance of our database. While there may be subtle differences in schema as we continue to make enhancements. For purposes of this question we can assume they are the same.
I would like to see which are the largest tables across all the clients. We use metricbeat to pull out data like size of the DB, size of every table etc. If I create a visualization and aggregate by table name . . . it will show me which table is the largest across the sum of all the database instances. What I want to see is which table is largest by client DB and table name. Luckily the db names are all different.
The two ways I can think to solve this are:
- create a new field in elastic and concatenate the values of the db_name & table_name
- modify the SQL metricbeat uses and add another field where I return the concatenated value of the db_name & table_name. This seems to be preferable given the cost of the dynamic field in elastic.
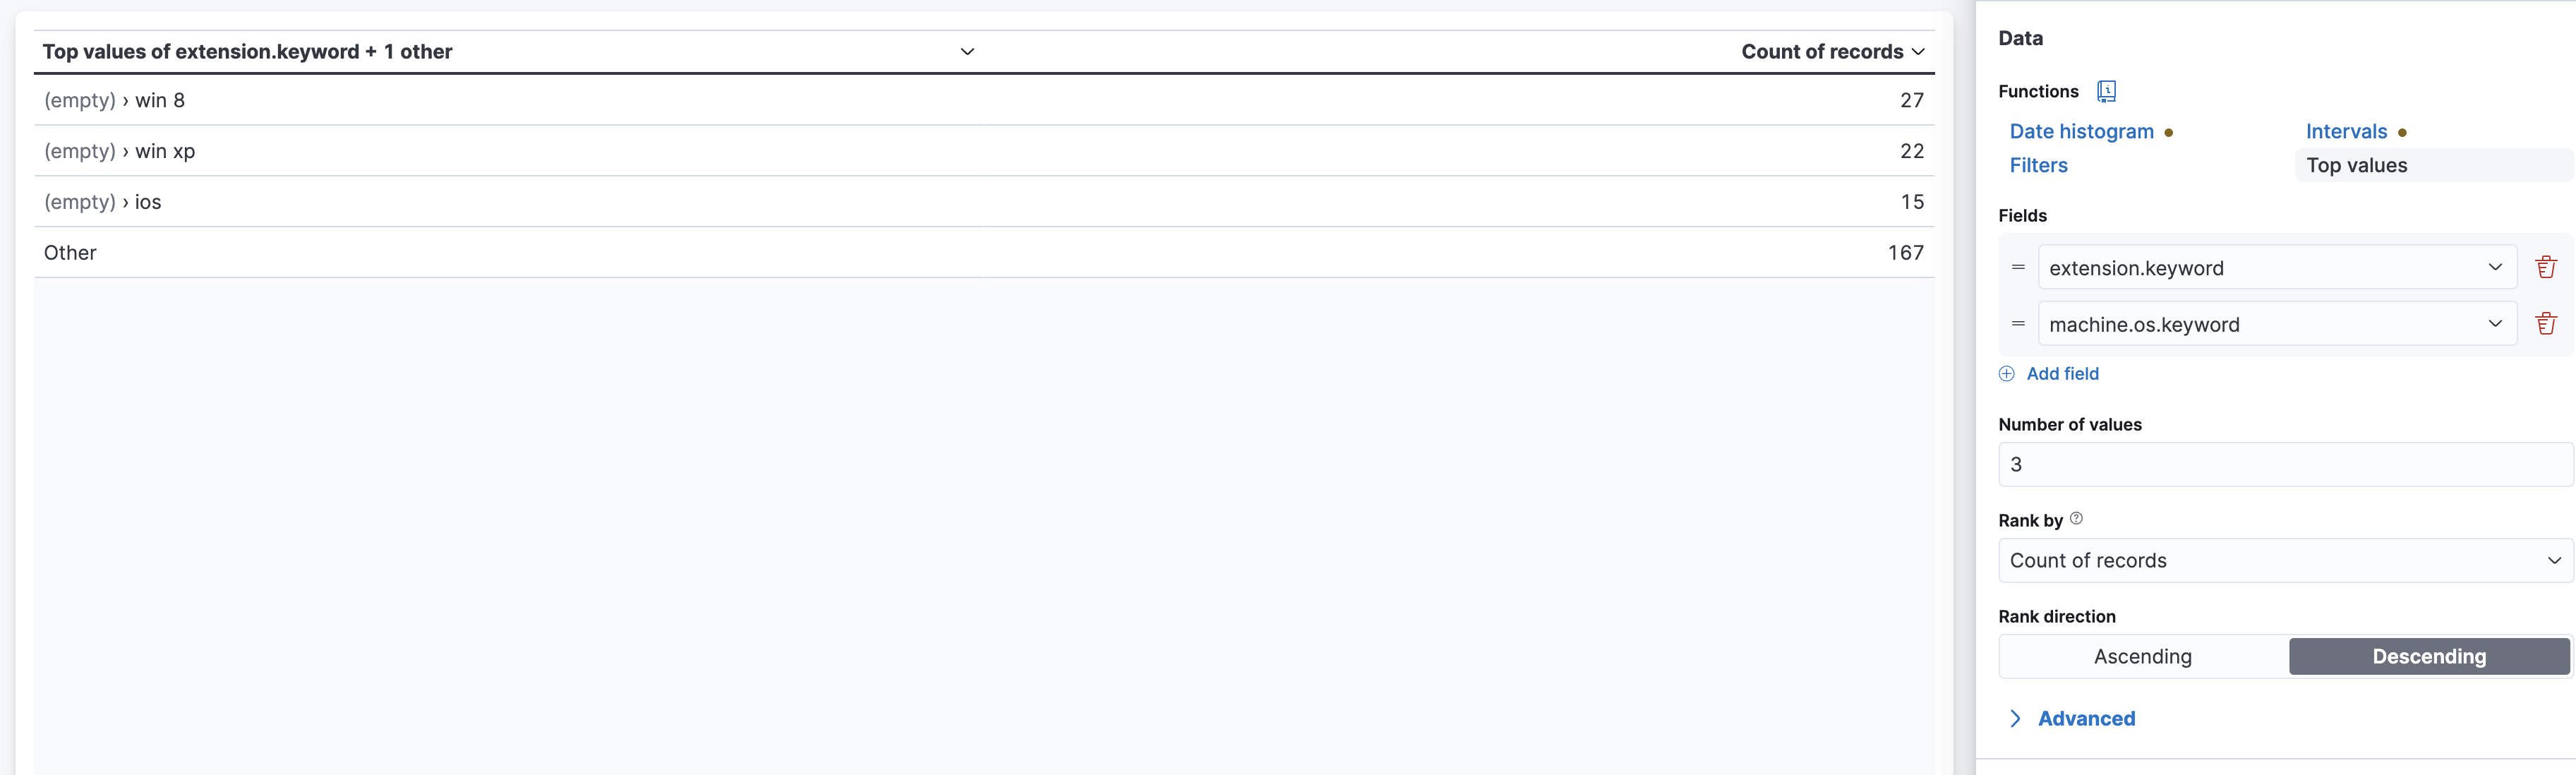
I'm an SQL person. This concept in SQL is as straight forwards as it gets. However, when I try to create a visualization I can add both the db_name and the table_tame as something I want to see, but they are essentially independent. Is there a 3rd way to solve this that I am missing?
Thanks,
Kohlman