Visualized failed using account.json file, all step is according to kibana's get started guid

es and kibana is the latest version.
I download account.json file from github, and use command curl -XPOST 'localhost:9200/bank/account/_bulk?pretty' --data-binary @accounts.json to load into es.

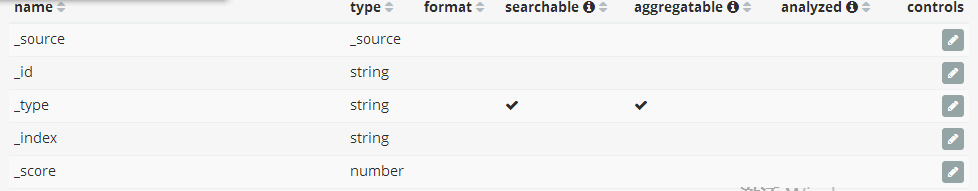
when I add index in kibana, I only get the following field:

then I use pie chart to gen graph.
I click split slices an bucket type, then select range aggregation, I get the folling problem:

I try to format account.json file to like shakespeare.json, Also I failed.
Please help me

What was the output you got when you ran the curl command? You should have seen a response with a bunch of JSON text such as:

    {
      "index" : {
        "_index" : "bank",
        "_type" : "account",
        "_id" : "995",
        "_version" : 1,
        "result" : "created",
        "_shards" : {
          "total" : 2,
          "successful" : 1,
          "failed" : 0
        },
        "created" : true,
        "status" : 201
      }
    }
  ]
}

I suspect that the data did not get indexed when you ran the command. The fields you show in your first screenshot is only meta fields.

You can check if the index has any data at all by running a _count query. You should see something like this:

% curl -XPOST -umy_user:my_password my_cluster_hostname:9200/bank/account/_count'
{"count":1000,"_shards":{"total":5,"successful":5,"failed":0}}