can someone explain to me, how to find out query data size produce when we request from kibana? I can understand that we may have more data size when we get back from elastic nodes?
Hi @Bjen_Shah
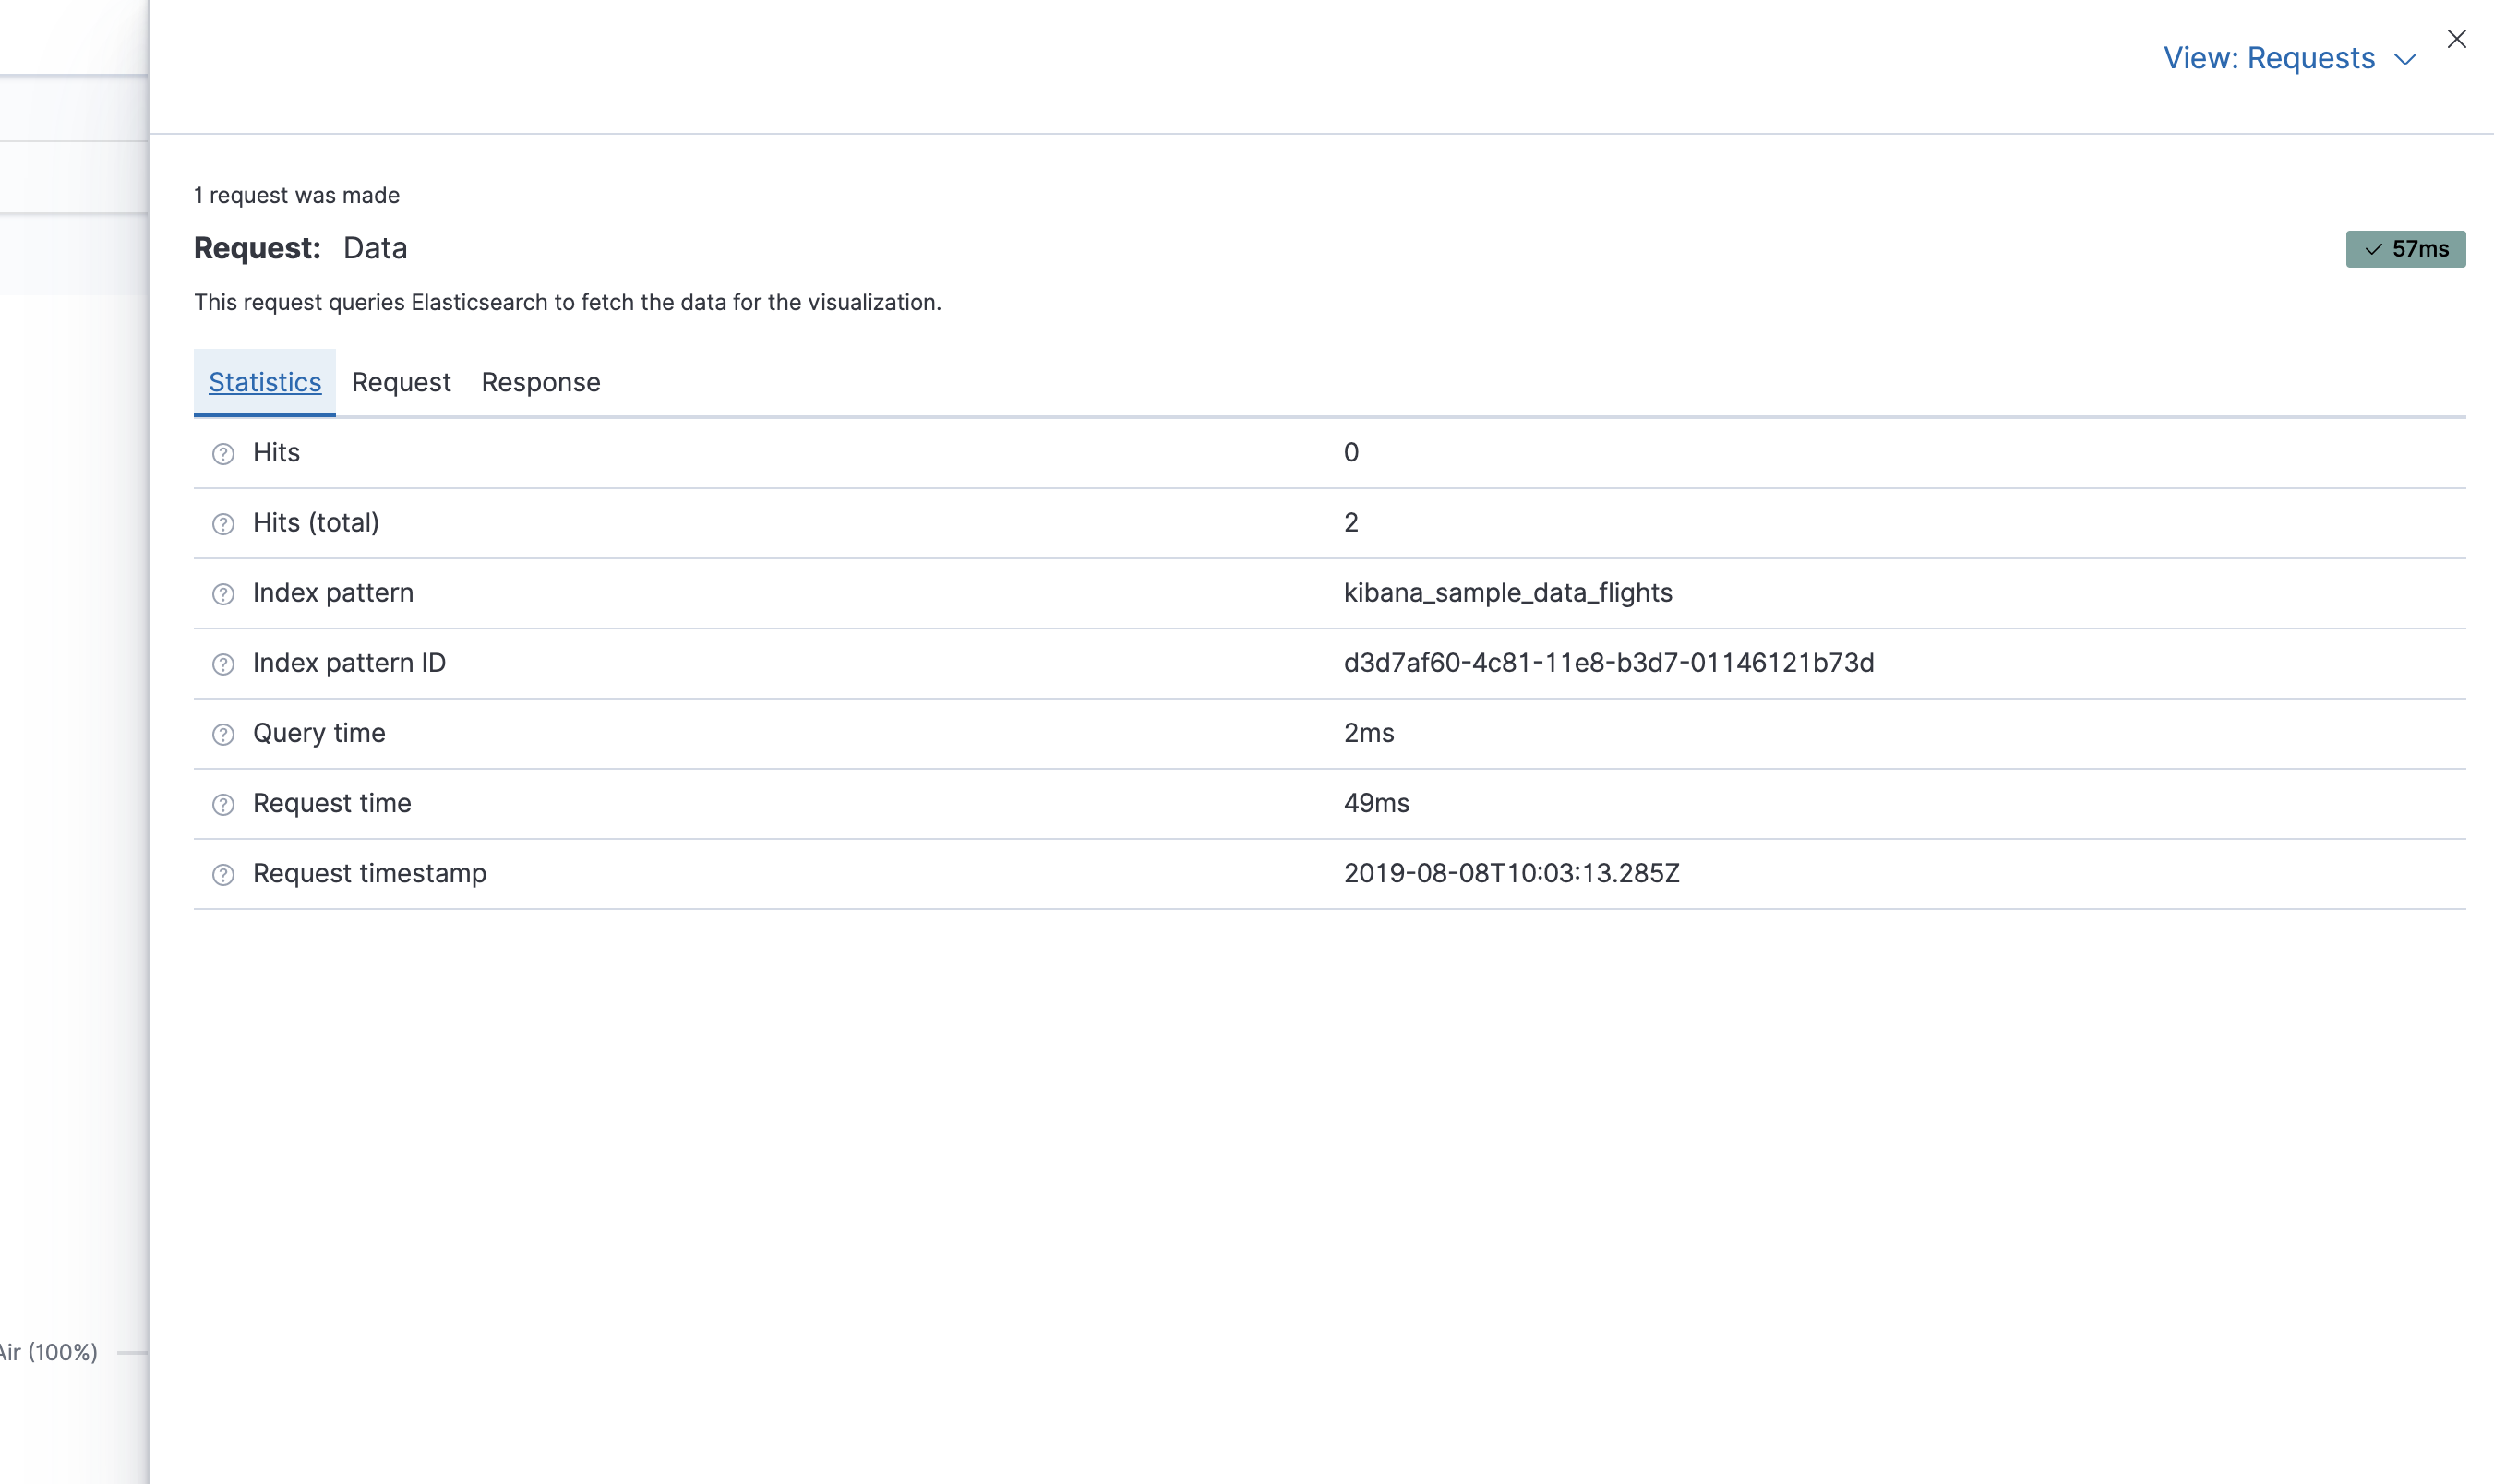
I'm not sure whether I understand you correctly, but for Kibana visualizations you can look into the requests made to Elasticsearch by clicking on the "Inspect" button in the menu in "Visualize" or on the "Inspect" in the context menu of Visualizations on a dashboard.
This will show you detailed information about request and response including the actual payload and should give you a feeling about the requests made to Elasticsearch.

For reference: https://www.elastic.co/guide/en/kibana/current/vis-inspector.html