Hello,
I am looking at what may be a bug that I believe started happening when I upgraded from Kibana 5.6.3 to 5.6.5. Images below.
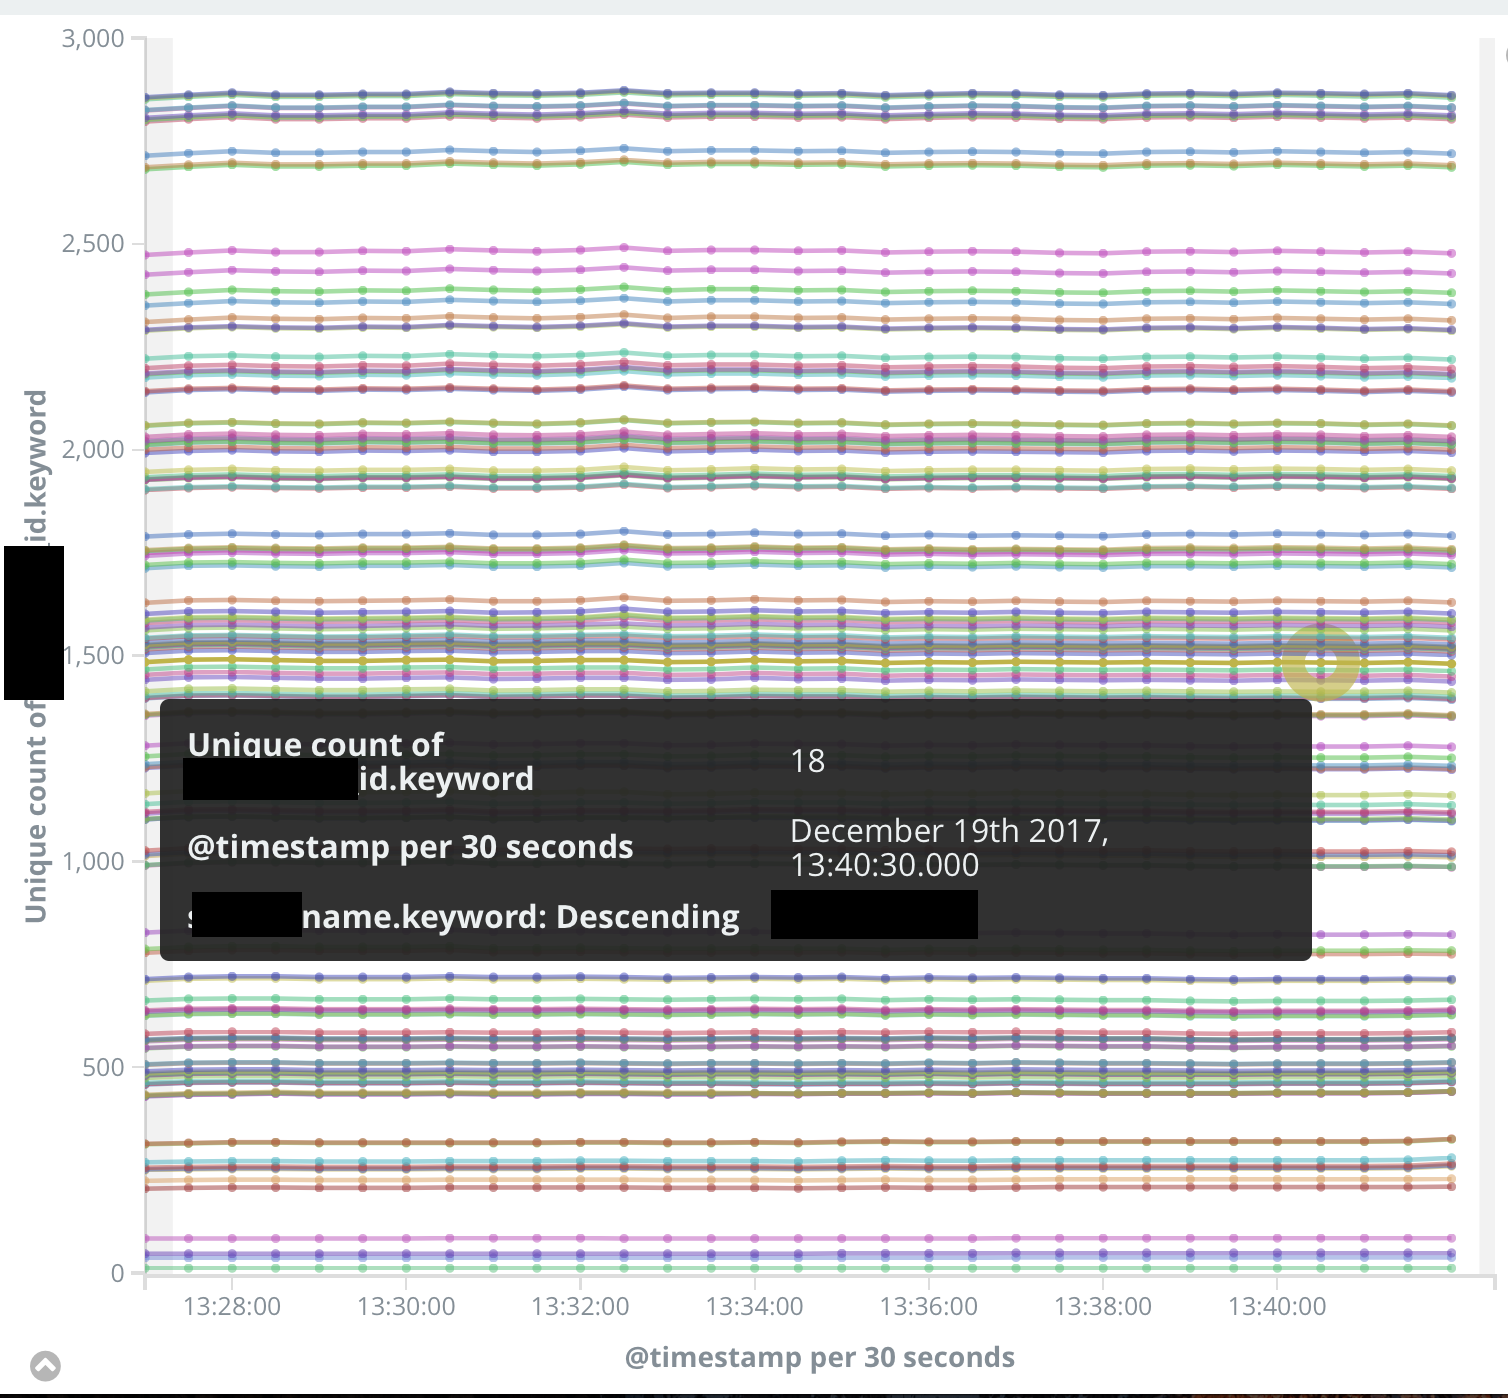
I have a plot that shows the unique count of IDs per names per time period (IE, a date histogram with a term sub-aggregation). When I hover over the dot, I see a (what I believe to be correct) value that does not match the plotted value and the Y Axis. The actual location and order that the subaggregations are plotted appears to have no obvious correlation with the value seen when you hover over the plotted point.

Is there any way for me to work around this? Thank you for your time!