ML "Anomaly Explorer" screen presents two visualizations: " Anomaly timeline" map and "Anomalies" graph. They use different timezones - " Anomaly timeline" uses UTC, while "Anomalies" - my local timezone.
IMHO, such combination in one screen is confusing.
What do you think? Should I open a bug or feature request?
Thanks for the question. Could you please let me know which version of the Elastic stack you're running, and also what you have your Kibana dateFormat:tz option set to (configured under the Advanced Settings tab of the Kibana Management page, as shown here
Currently the visuals in the ML plugin will only display times in your local timezone (where dateFormat:tz is set to 'Browser'). This is something we will address in a subsequent release. However in my tests, when I have the Kibana dateFormat:tz option set to something other than 'Browser', although the times shown in the Anomaly Explorer remain in the local timezone, the times in the Anomaly timeline, anomaly charts and table are all consistent. I'd like to understand why you are seeing different times in the timeline and charts.
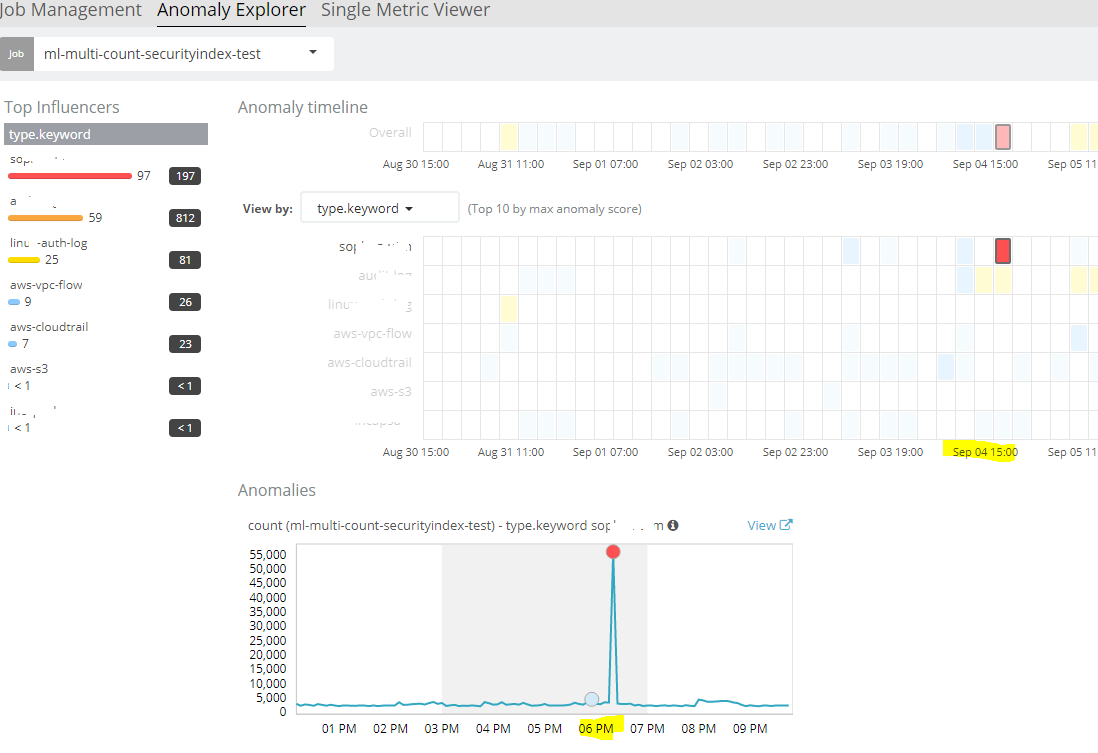
Would it be possible to attach a screenshot of an example in the Anomaly Explorer where the Anomaly timeline and the charts are using different timezones? I've not been able to reproduce the issue with any of the jobs in my setup.
Looking at your screenshot, I think the timeline 'swimlanes' and the anomaly charts are in fact both using the same timezone.
It is important to note that the data in the timelines is bucketed into intervals, depending on the time range set on the dashboard and the bucket span of the job(s) selected. So in your screenshot, each section in the swimlane represents four hours. The colour of each section indicates the highest score seen in that interval, which in your case is an anomaly at around 18:30.
The anomaly charts below however are always plotted using an aggregation interval equal to the bucket span of the job - to ensure we show the actual anomaly in the data and don't get any 'smoothing' effects from a longer aggregation. The time range of the selected timeline section is indicated by the central grey shaded region on the anomaly chart - spanning the four hours of the selected job here. So the grey section in the chart starts at 15:00 on September, the same as your selected timeline section.
I notice that the date axis labels are using different time formats - "15:00" in the timeline, but "3PM" in the chart. We will look to address this in a future release, as well as the fact that we don't follow the Kibana dateFormat.tz setting when it is set to something other than 'Browser' as I mentioned earlier.
Apache, Apache Lucene, Apache Hadoop, Hadoop, HDFS and the yellow elephant
logo are trademarks of the
Apache Software Foundation
in the United States and/or other countries.