Kibana 7
I have a table visualisation with with a total column and two Unique counts. I now want to be able to drill down into the cells to see a further level of detail for each of those cells.
Signature 	                                       Total 	SrcIPs	DstIPs
ET POLICY Vulnerable Java Version 11.0.x Detected	1,507	     9	     9
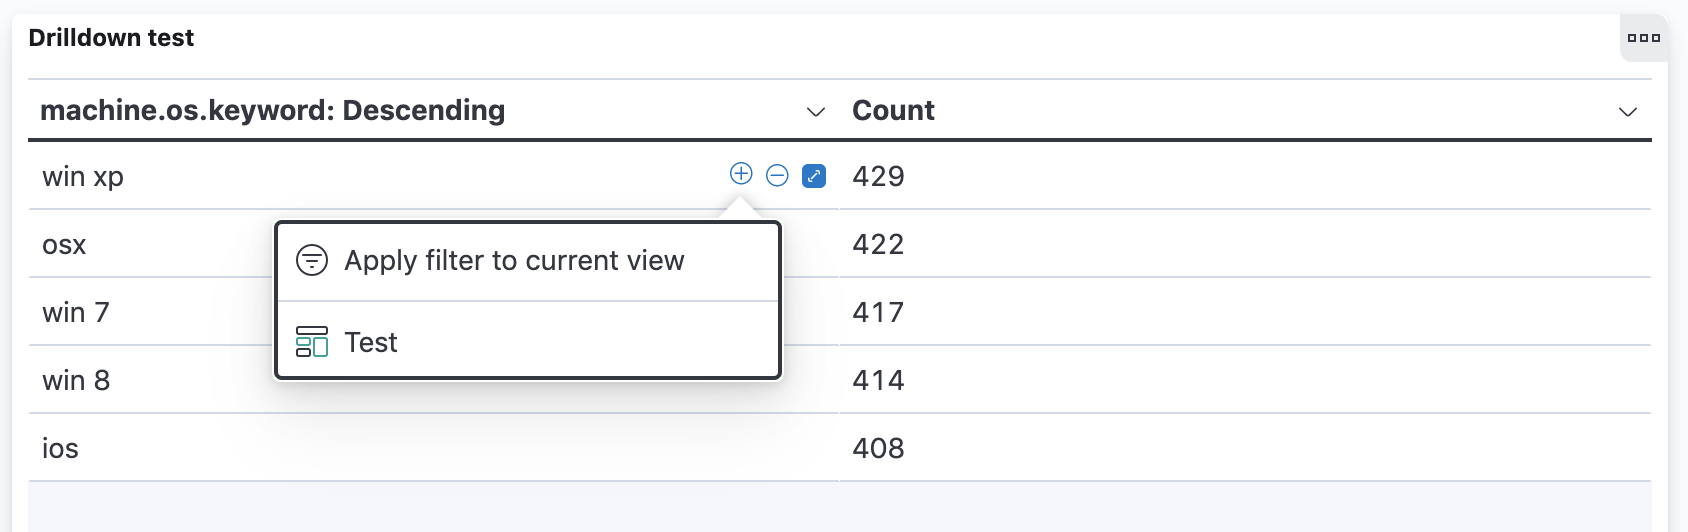
The table is in a dashboard and I have created dashboards for the targets of the drill down. I added a drill down to the dashboard containing the table but I can't figure out how to attach this to a table cell and how the the filters get passed.
I.e. I want to click on the cell for the number of src IPs and have it display another table with a break down for that IP.
Click on the total cell take one to a dashboard that shows the individual alerts.
My searching finds docs saying it is possible but no explanations of how to do it.