Hi,
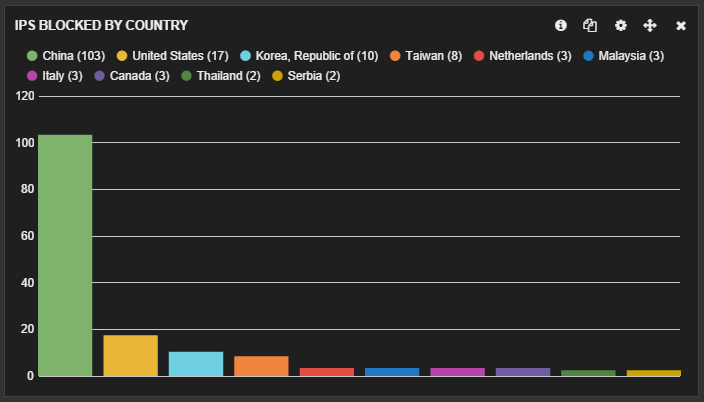
I know this must be very easy but I can't figure it out. I have some documents that contain an IP and a country. I want to create a bar graph that shows the count of each country but also gives an individual color to each country.
Similar to this
However something simple as metric: count and term: country will give a separate bar for each country, but not a individual color.
Edit: Splitting the chart gave the desired result.
