Breakdown Y-Axis value by other terms

Hi, I am working on building a vizualisation that shows the amount of time a person has worked on tasks. I am able to create a vizualisation showing the total amount of time a person has spent on a task, but now I want to break down that total amount of time into the amount of time they have spent on each individual task, instead of the overall amount of time.

Here is the document that I'm working with, I want the yaxis to display the different components.value as sections, which will be the total of the timeRemaining. With the xaxis being the user field.

This is my index mapping.

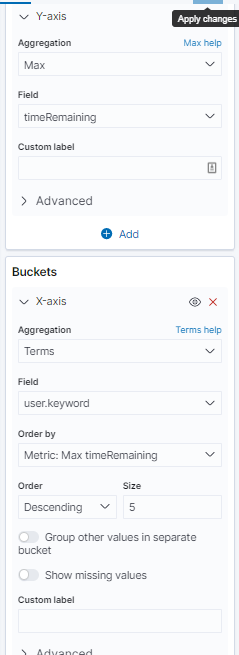
And these are the visualization settings that I currently have that display the user, and the total timeRemaining, which I'm unsure how to switch into a vizualisation of the components.value totals.

Please let me know if there's anymore info that I can give to get this working. Any help or advice is appreciated. Thanks.

The reason why this doesn't work is the way Elasticsearch is indexing your data.

Your source document looks like this:

{
  components: [
   { label: "Component 1", value: 30 },
   { label: "Component 2", value: 60 }
  ]
}

But in the index this object is flattened:

{
  components.label: ["Component 1", "Component 2"],
  components.value: [30, 60]
}

This means the aggregation behind the visualization doesn't know about the relationship between these two fields (it can't match the values with the right labels).

In Elasticsearch it's possible to define components as nested, but Kibana visualizations don't support this data type.

If that's possible for you, consider changing your document shape - instead of one document with a components array, split them up into one document per component:

{
  components: [
   { label: "Component 1", value: 30 },
   { label: "Component 2", value: 60 }
  ],
  user: "User"
}

becomes

{
  label: "Component 1"
  value: 30,
  user: "User"
}

and

{
  label: "Component 2"
  value: 60,
  user: "User"
}

Then Kibana knows which label matches which value and you can create your chart by using a Terms aggregation on the user field on the x axis, a terms aggregation on label as split series, and a max (or sum, if there can be multiple documents per user per component) of value for the y axis metric.

The split filter logstash plugin can do this for example: https://www.elastic.co/guide/en/logstash/current/plugins-filters-split.html

2 Likes

This topic was automatically closed 28 days after the last reply. New replies are no longer allowed.