Hello everyone!
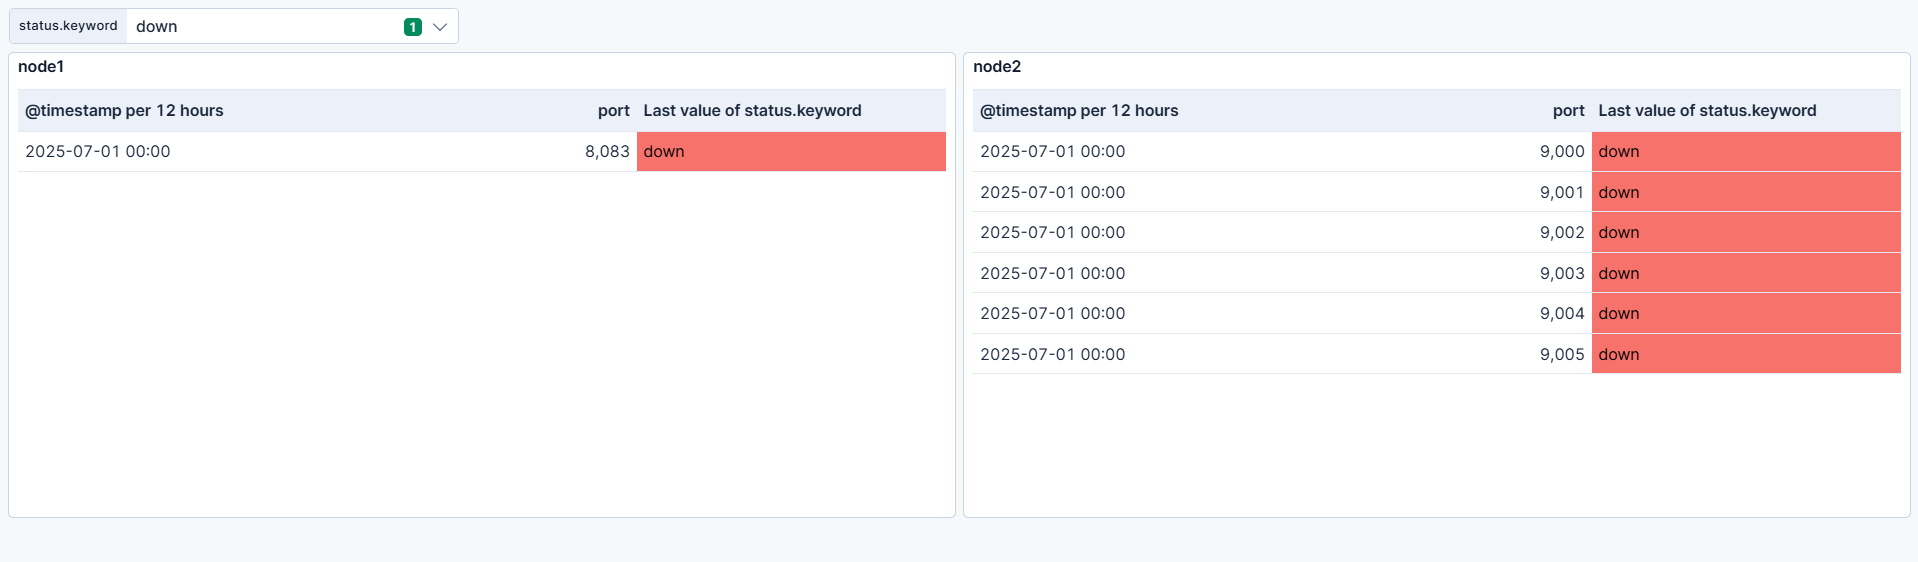
I have one dashboard to showing uptime monitor. It shows all ports for 2 different nodes. So 2 panels with name 'node 1' and 'node 2' and 2 tables for each (same but with filters for dedicated nodes). Tables shows the list of ports and status (up or down).
I need that background of panels 'node 1' and 'node 2' change the color: 1) when all ports are up - green; 2) when some ports are down - orange; 3) when all ports are down - red.
Also it's ok only with two colors (green/red).
Spend few days for that and still didn't find the solution.
Hello @Dariia_Hrebenichenko
I am not sure if your requirement is as below , if not please share example :
We can add the color you want for the cell as below =>
Click on the metric or cell in the lens for which you want to change background => Color by value => Cell => Color Mapping => Enable => Add assignment =>
Thanks!!
Hi @Dariia_Hrebenichenko
I think the best option in this case would be to create a separate panel for each "node".
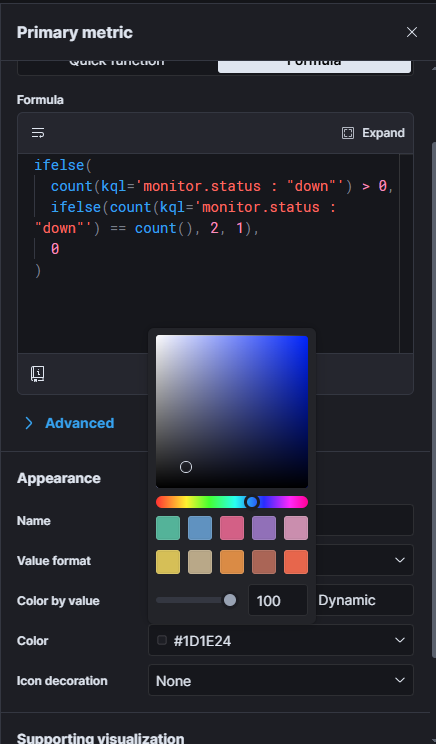
The new panel can be a metric with the following formula:
ifelse(
  count(kql="status: down") > 0,
  ifelse(count(kql="status: down") == count(), 2, 1),
  0
)
I've assumed the status: down as a filter in your case, but feel free to adjust based on your mapping.
This will color code the values as follow:
- 0 => no port down
- 1 => at least 1 port is down
- 2 => all ports are down
If you put it next to the table I think it would be useful.
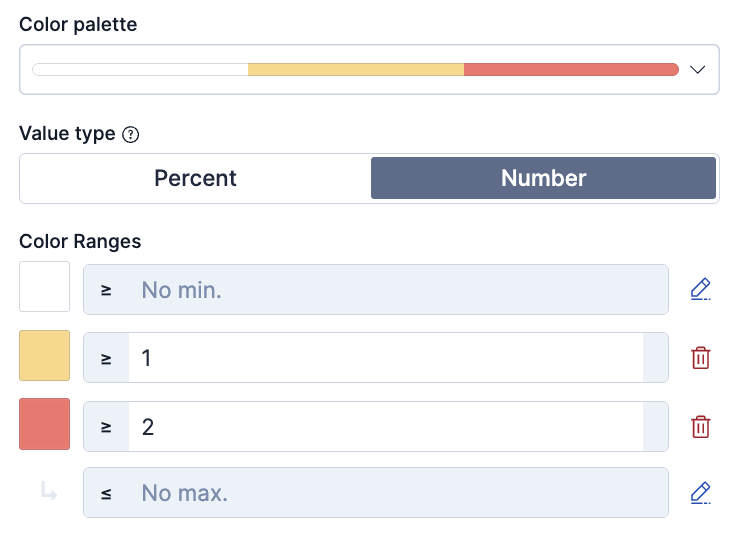
Of course the primary metric colouring should be set to dynamic colouring and the color coding above should be configured:
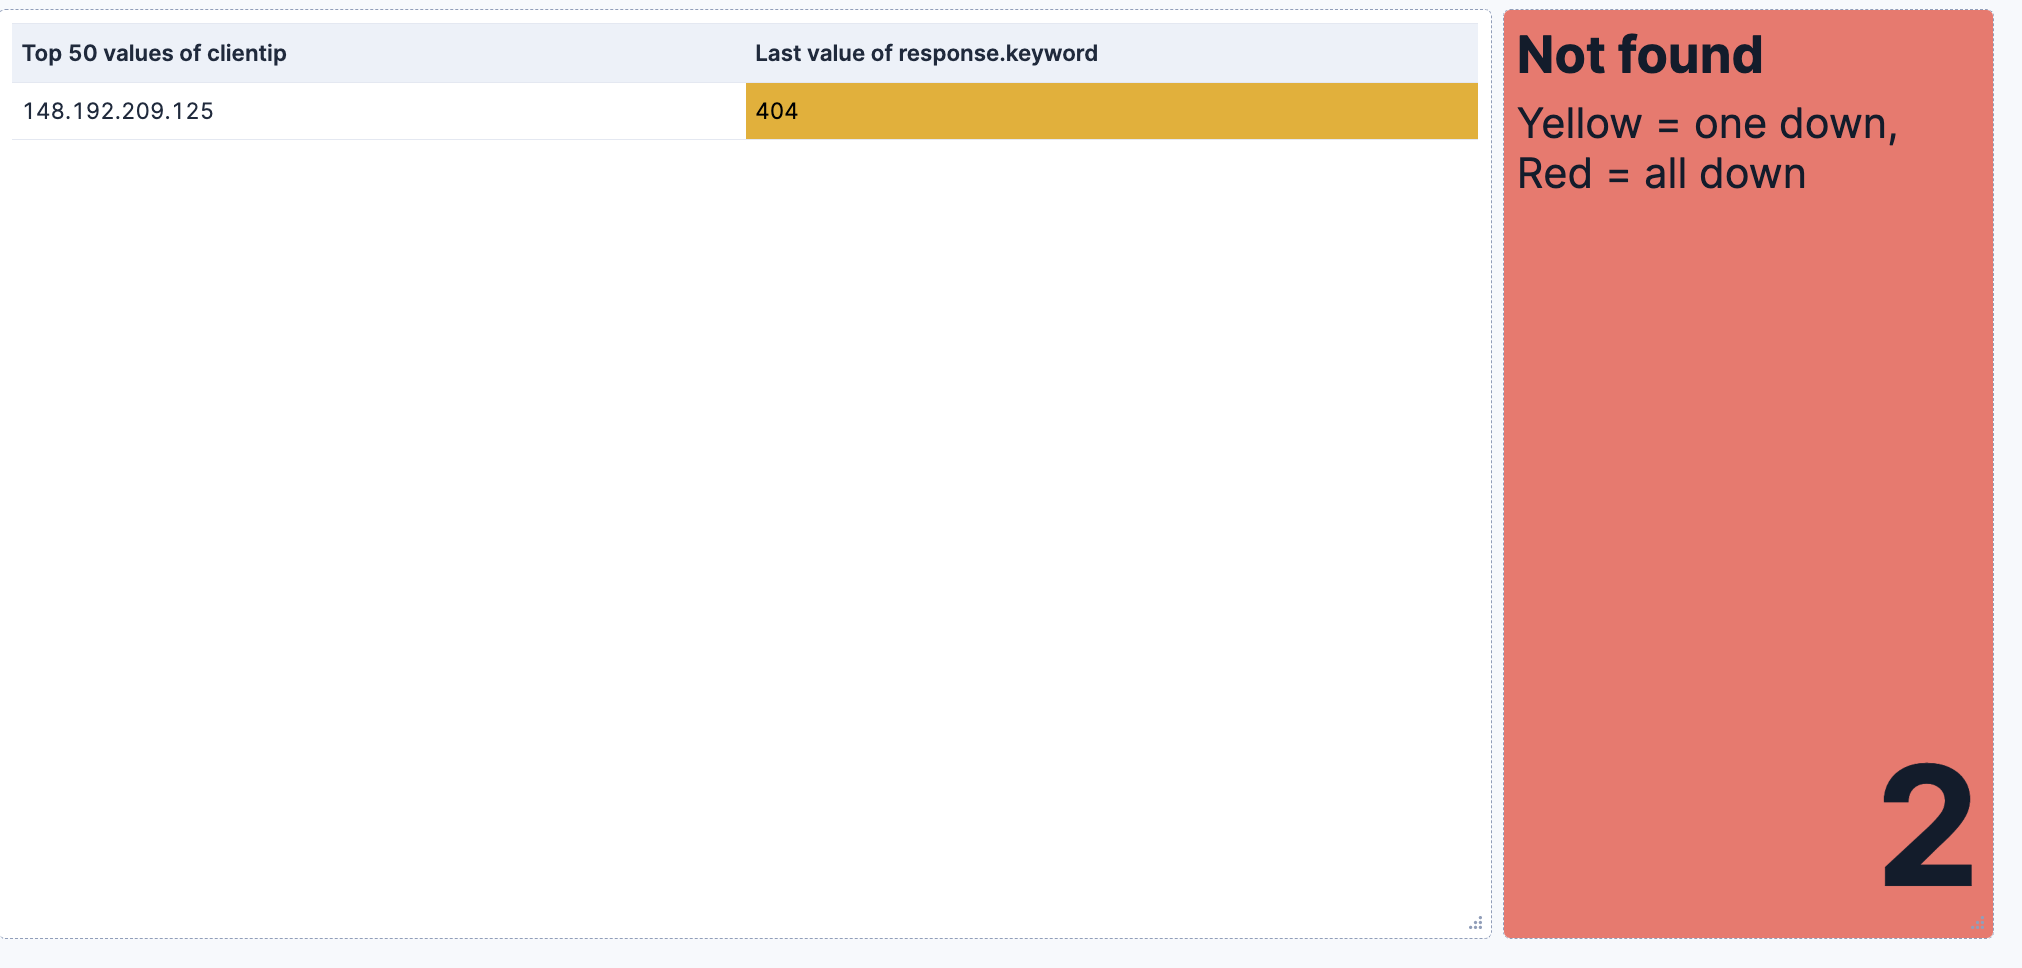
I've reproduced an example checking for 404 responses in a dataset:
no 404
At least 1 404
All 404s
Thank you for your unswer!
Already did this:
What I want is that panel 'Node 1' and 'Node 2' could change background color depending of the table (status)
What's the type of those panels? Markdown? TSVB? Lens metric?
Thank you for your answer!
For now I have like this:
And need that background for panels 'Node' could change.
Is it possible do like in your example? (I already have dedicated filters for this).
I tried to do something like that, but wasn't successes 
Panel 'Node' is Markdown (for now) because I need to show only this.
I try to do in Lens metric, but it always shows numbers (I don't need it)
I think you can play with the panel size to make the value go outside the panel.
Try to add a subtitle with few empty spaces and resize the Lens metric with the same size of the markdown panel, the value should go out.
Also when I do in lens metric, I can only put one color:
Thanks again. Think it's the best solution