hey there!
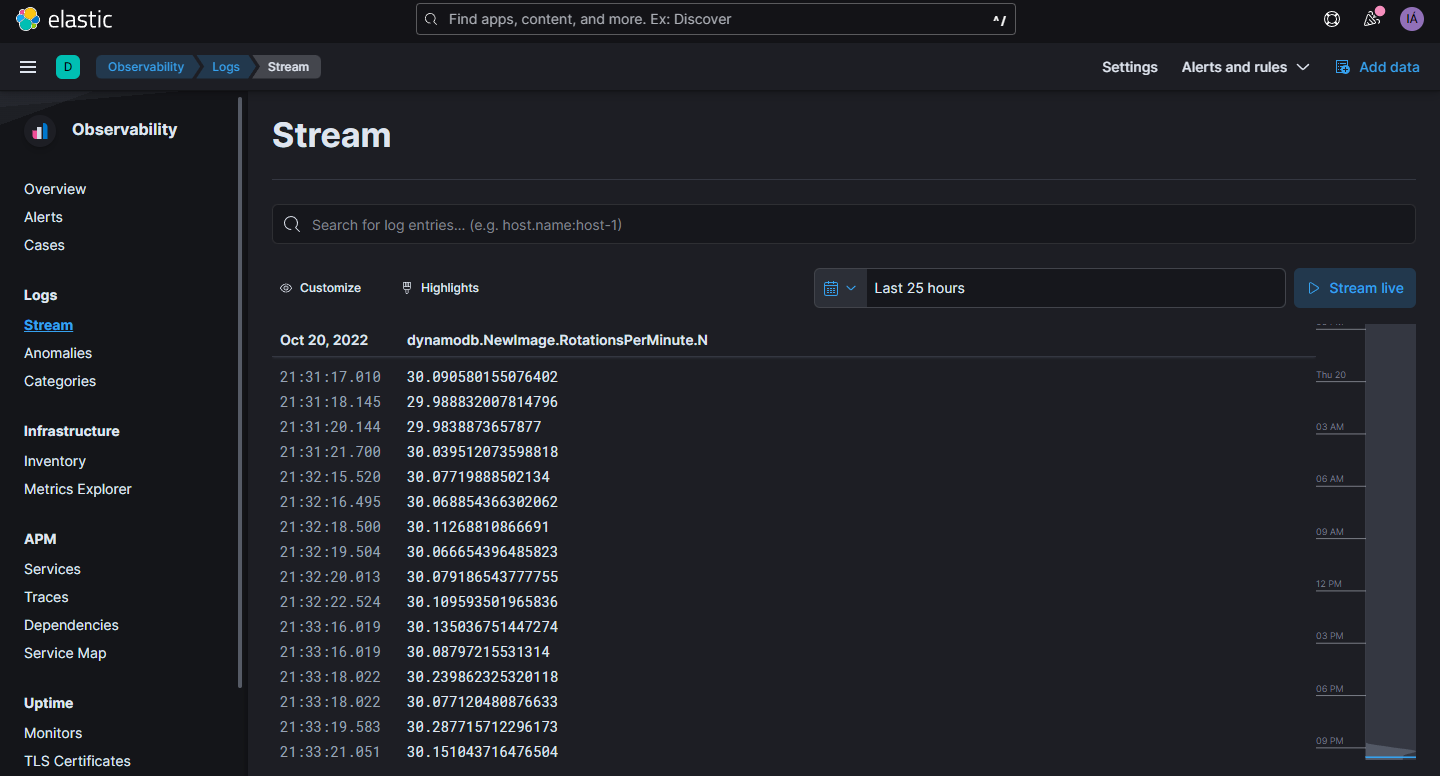
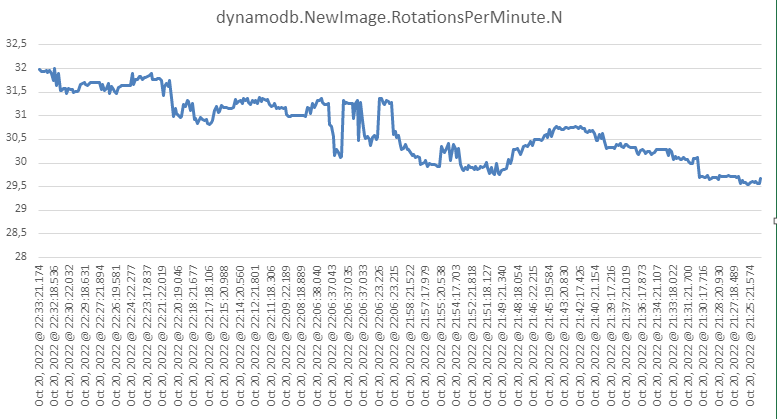
I need to create a graph with the stream data, I attach an example graph that I need to create and stream logs.
I appreciate the support, I have tried to create but without results,
best Regards
Ismael
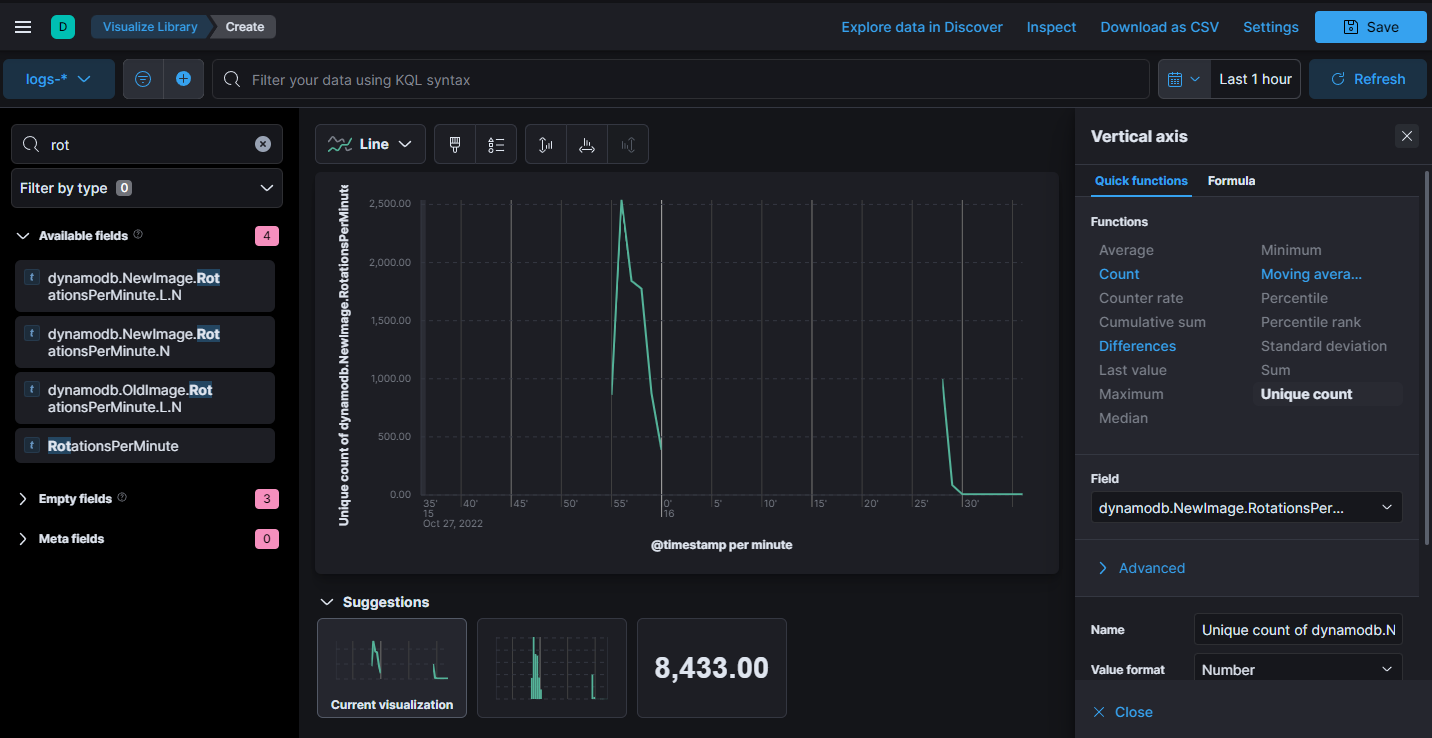
If the field from your streamed data is of a numeric type you should be able to render your chart normally in Kibana using the line chart type in a new Lens visualization.
What have you tried? What is the mapping of the data you want to render?
You can check the mappings of your index from the Kibana DevTools console calling to GET your_index/_mapping or from the Index Management application
Maybe i need convert data from string to number, Any ideas to do this quickly?
If there's not a lot of data you may want to add a runtime field to your mapping or your Kibana Data view to convert the data on read. This may be slow if you are hitting a large amount of data so your other option is to reindex the data with an ingest pipeline.
© 2020. All Rights Reserved - Elasticsearch
Apache, Apache Lucene, Apache Hadoop, Hadoop, HDFS and the yellow elephant logo are trademarks of the Apache Software Foundation in the United States and/or other countries.