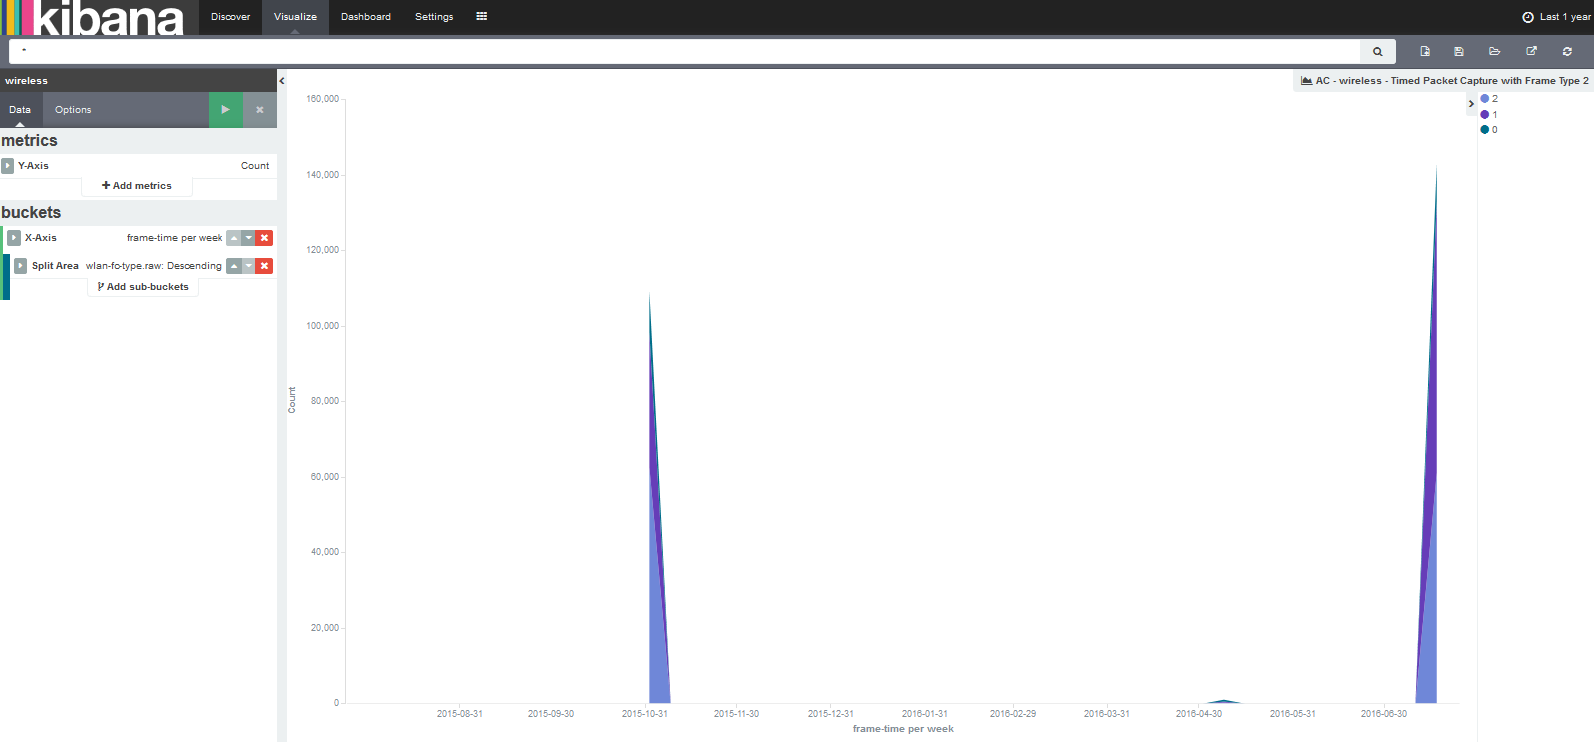
The reason I need this is because I want to start with this visualization (1 year zoom) Each line is a pcap file with a number of time stamped packets:
Notice I cannot do this with the click and drag as I get this terrible screen in-between zooms. Is there anyway to disable this screen and have it just show the 1 data point until I zoom in further?
Sadly no. I want to allow a single dashboard to display all uploaded files. Then allow the user to filter to there specific file. Which means that all dashboard times must be dynamic not relative.
Example: It's 7-25-2016 >> User uploads a pcap file from 5-31-2016 >> The file involves 5 seconds of packet capture between 12:31:30 & 12:31:35 >> The chart must dynamically show these 5 seconds or allow the user to select these 5 seconds
Apache, Apache Lucene, Apache Hadoop, Hadoop, HDFS and the yellow elephant
logo are trademarks of the
Apache Software Foundation
in the United States and/or other countries.
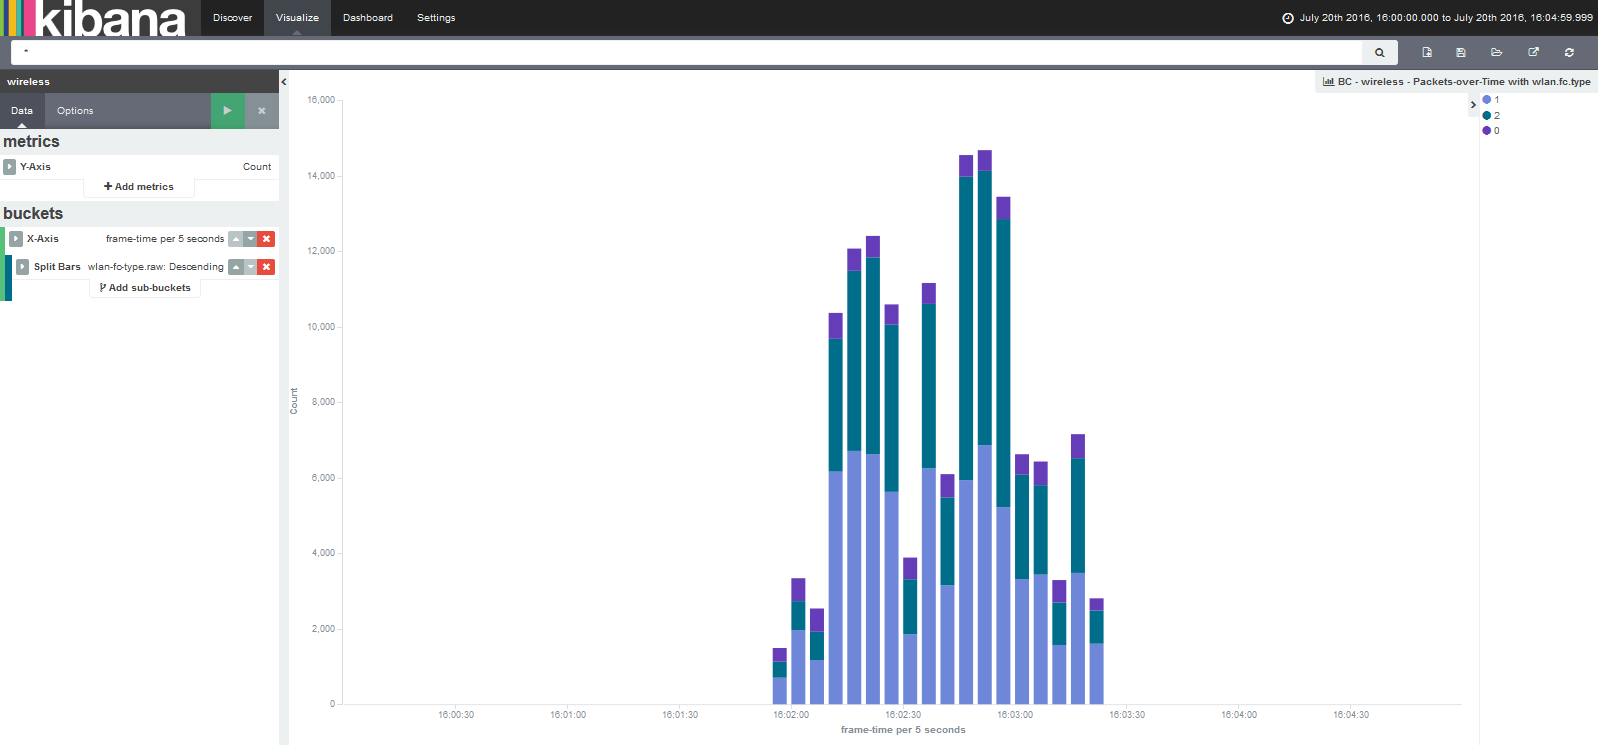
 ) bars do not


 (I know a line needs 2 points but it's still dumb)