I imported the dashboard and mapping as explained in the docs. I have a simple logstash config for importing the data.
Data shows up just fine in discovery but for some reason visualbuilder is having another one of its tantrums where it just refuses do show data. The data is obviously there but even if I try recreating a visualization it doesn't show anything. I can build visualization with the same data using the normal Kibana visualizations.
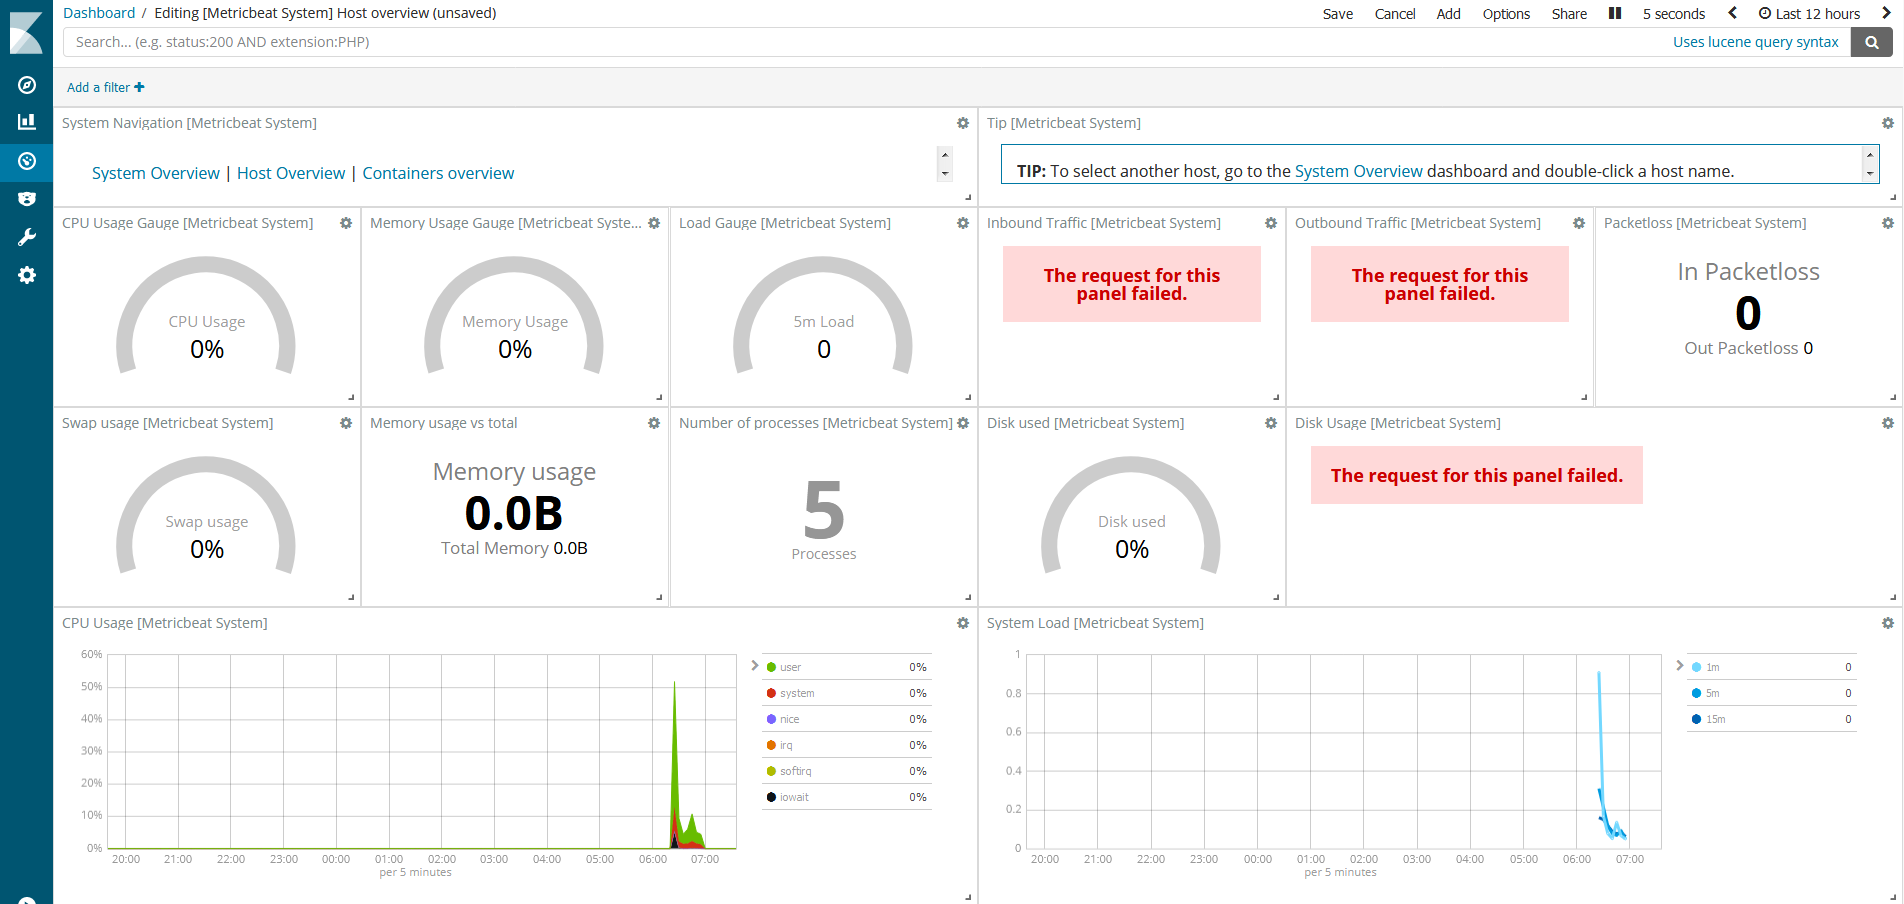
Regarding the gauges, they need to have data during the selected time range, specially at the end of the period, please try to select a time range with data along all the period.
For the dashboards with errors, what versions of Elasticsearch and metricbeat are you using?
Kibana Version: 6.2.1 and Metricbeat 6.2.3 I believe.
I also don't believe the process by memory visualization can work. Its calculating on system.process.memory.rss.pct which is a % value, where does it get the name from? There is a process.name field but that's not on the actual mapping as far as I can tell. Selecting it in visualbuilder gives graphs but incorrect ones. Works fine on normal visualizations.
By default the process name is not selected under terms but going with the default visualization as provided by the metricbeat package results in the error from the OP.
I installed the latest version of metricbeat on my host and remove the template & index from my server, set metricbeat to output directly to elasticsearch and now all data is showing up.
I don't know what caused the problem. Will try again to input data from Logstash.
Apache, Apache Lucene, Apache Hadoop, Hadoop, HDFS and the yellow elephant
logo are trademarks of the
Apache Software Foundation
in the United States and/or other countries.