I am new to ELK and creating dashboards with ELK for nginx access logs. I found its pretty useful on creating nice visualizations. On my requirements one more datatable is pending, the requirement is given below (I am using the deafault logstash-* index).
Each NGINX access log provides the URLs been hit by user. I need to create a datatable containing only the URLs which took maximum response time more than one second with the count of URLs. So the table should contain 2 columns.
URL
Total count of URLs
Workarounds: I can sort out URLs based on max response time. But te list contains URLs for which reponse time is less than 1 sec too. I want to filter out the URLs with max response time more than 1 sec.
What you are trying to achieve should be possible to do in Kibana. Could you please provide two pieces of information to help me figure it out?
The exact range query that you tried (but didn't help out), and
The request that was sent from Kibana to Elasticsearch. To get this, find a little up arrow on the page you are on in Kibana. It looks like this: . Click it to open a "spy panel". Click on the "Request" tab in this spy panel and paste its contents in this post.
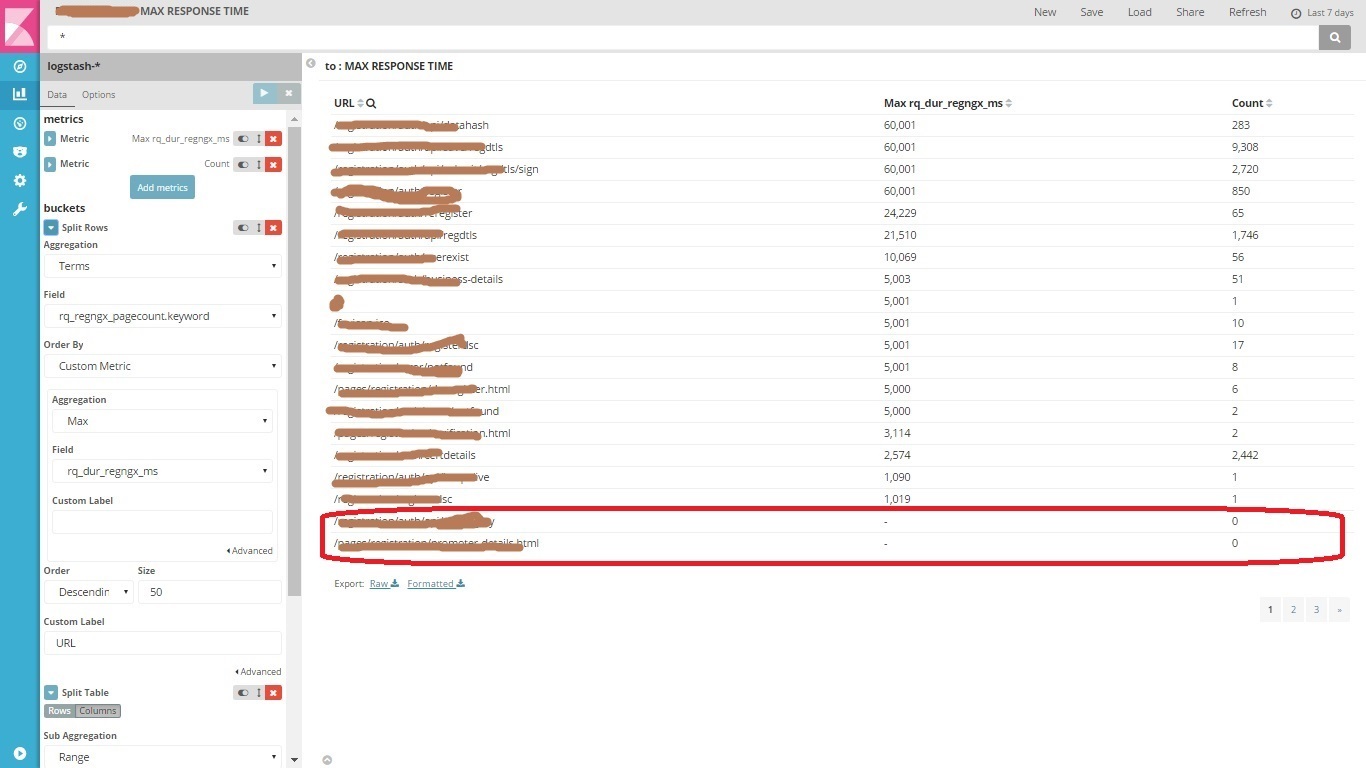
I have added 2 screenshots in which you can see my Kibana configurations.
I have improved my data table by including the range and is working fine now. Please check the ScreenShot_1.jpg.
In resulting datatable you can see the last two rows, which is not required in the result set for me. (the table contains more rows in the next page, all containg rows less than 1000 ms response time, which are nto required in table). Please suggest me on how to avoid this.
Adding below the json payload to elastic search too as required by you:
Apache, Apache Lucene, Apache Hadoop, Hadoop, HDFS and the yellow elephant
logo are trademarks of the
Apache Software Foundation
in the United States and/or other countries.