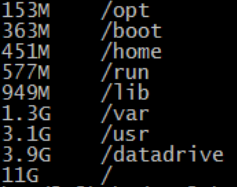
The /dev/sda1 used went from 6.2g 13% to 49g 100% in 4 days.
The memory free went from 51g to 2g in 4 days.
How do I manage it?
8/3:
-- reboot
-- /dev/sda1 6.2g 13%
-- memory free 51g
after 4 days.
8/7:
-- /dev/sda1 49g 100%
-- memory free 2g
df -h

free -g
sudo du --max-depth=1 --human-readable / | sort --human-numeric-sort

I have only elk running on this vm.
I have only one logstash job running.
elk is running from /datadrive and not from os drive.
/datadrive/usr_share_logstash/logstash/bin/logstash
/datadrive/elasticsearch-6.0.0/bin/elasticsearch
/datadrive/kibana-6.0.0-linux-x86_64/bin/kibana
path_logs and path_data are set to /datadrive and not to os drive.
path.logs: /datadrive/elk/logstash/path_logs
path.data: /datadrive/elk/logstash/path_data
path.logs: /datadrive/elk/elasticsearch/path_logs
path.data: /datadrive/elk/elasticsearch/path_data
logging.dest: /datadrive/elk/kibana/path_logs/kibana.log
path.data: /datadrive/elk/kibana/path_data
ls -lh /datadrive/elk/kibana/path_logs
![]()
ls -lh /datadrive/elk/elasticsearch/path_logs
ls -lh /datadrive/elk/logstash/path_logs
![]()
