We are using Kibana version 5.6.12 and since 2 weeks ago I am noticing that the results shown in a Data Table Visualization are much less than the results returned in the Discover for the same query.
We are using the grok filter in logstash to define the part of log which I want to display in my Visualisation: %{GREEDYDATA:reason}
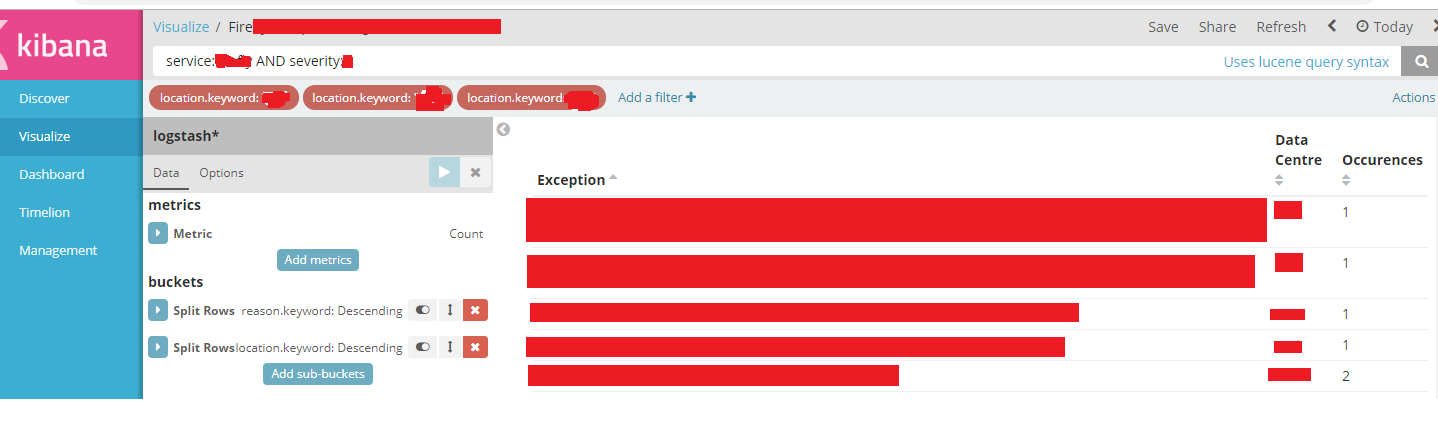
The query and timeframe are pretty much the same. Below are a sample of the results (sensitive data hidden):
This proves that the query is actually working in the Visualize but for some reason it is not displaying all results when i include the reason.keyword.
Is it possible that some of your more recent data has missing values for reason.keyword? Documents that don't have this field would likely not appear in the visualization, but they would appear in discover based on your query
I am chrisgr's college at work and working on this same project.
Basically 'reason' is a tag named to a section of our logs to distinguish part of the whole log pushed from logstash. We want to display this in a table visual we have created. The issue here as Chris said is that the 'reason' section is visible in the discover section on Kibana but when we run the same query in the visual section we created, part of the logs ( mainly the very long and beefy logs) are not displayed.
I am suspecting that it is some thing with the grok scripting in the logstash config file or an update we recently did on the kibana server.
Below is the script we are using in the logstash config file to display the visuals which at first was working fine but now it is not:
All the *s are for internal data protection purposes but this the way it is placed in the logstash config file. Is it possible to check the grok syntax whether it is well scripted or what is missing from it?
I checked with the built-in Grok Debugger and logs are actually being parsed correctly. Tried different logs (all with same format) and got the results i wanted. Is there any other configuration that i might be missing? Or any other option in the visualisation?
Replying to your first comment, the grok pattern is defined on all logstash nodes, therefore all documents should have this field defined. Is there a way that i can check in the docs themselves in ES nodes to be 100%?
Also as Duncan mentioned earlier I am noticing that the missing logs in the visualization are quite large. Could this be a limitation in Kibana? But then again, how come they worked before?
I am really running out of ideas and i need this working for our daily activity.
Apache, Apache Lucene, Apache Hadoop, Hadoop, HDFS and the yellow elephant
logo are trademarks of the
Apache Software Foundation
in the United States and/or other countries.