Do both of these use the index pattern, and shouldn't both get the same query results for the same time frame and the same index? Anything I can check that would cause disparity?
Hi Patrick. There should be an "Inspect" button on the top of the page in both applications. You can use this to see the Elasticsearch queries and results. Perhaps you can find the cause of the disparity by comparing the query/result of both applications.
Thank you @nickpeihl! Didn't know about the Inspect button, this is helpful! Turns out there was not, in fact, a discrepancy and I just didn't understand what I was looking at.
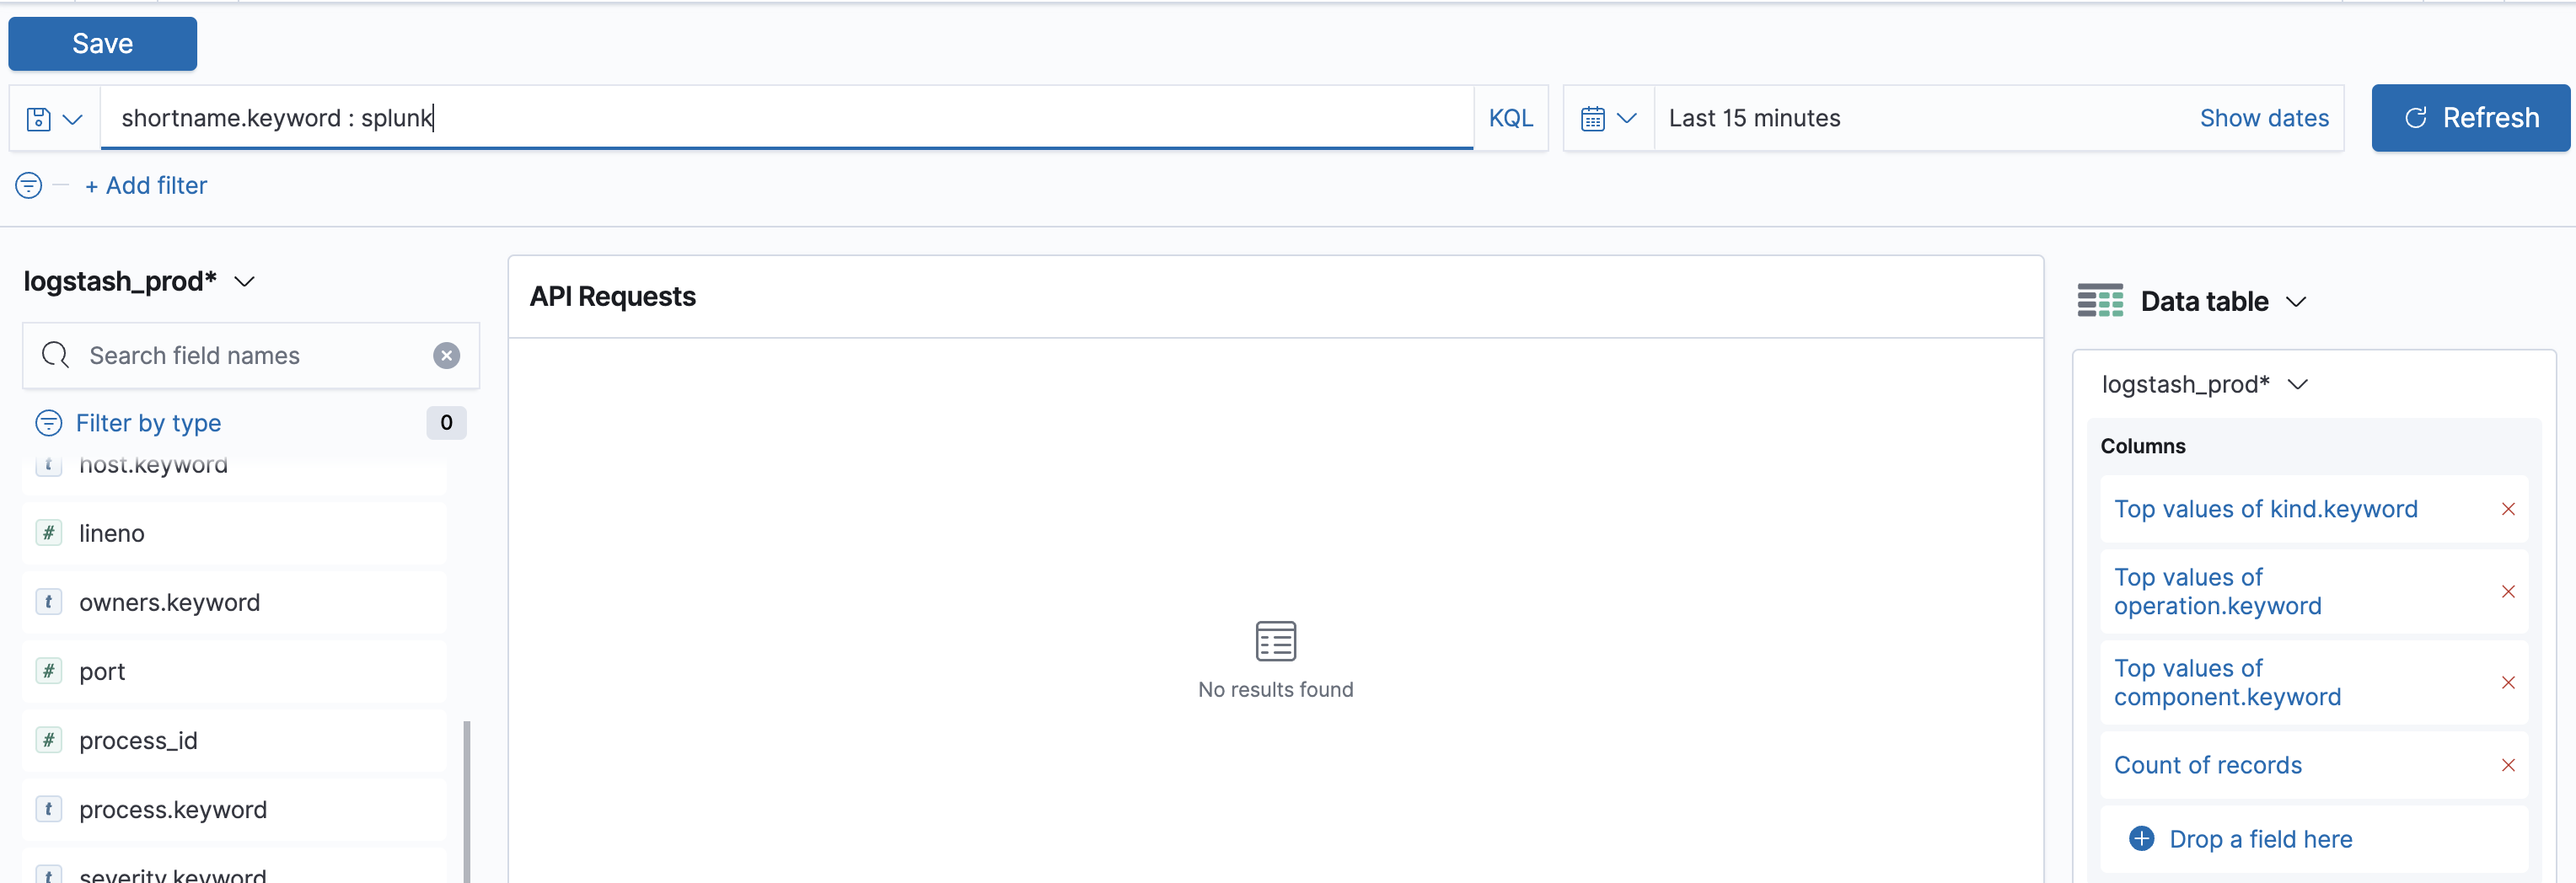
I was looking at a Lens, when I thought what I had was an aggregation-based viz for a data table.
Interestingly, I didn't see the Inspect button on the Lens creator, but I did see it elsewhere and it's a useful tool.
Apache, Apache Lucene, Apache Hadoop, Hadoop, HDFS and the yellow elephant
logo are trademarks of the
Apache Software Foundation
in the United States and/or other countries.