Hi!
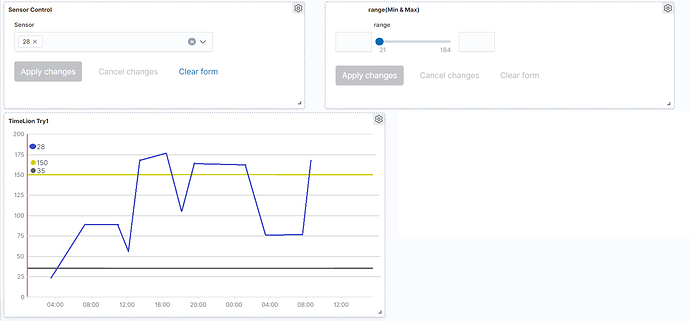
The two horizontal lines (yellow and grey) are statics. I need these two lines dynamics. I have to input two values, and the two lines will be on this two values.
For example: i input 20 and 50, and i want to see two horizontal lines on y=20 and y=50.
My y is the value of a sensor. I would like to do this with a range, but it only zoom the plot.
Anyone has suggestions?
