Gauge shows 0 if latest record is missing key

Hi all!

I'm having an issue with a Gauge that I'm hoping the community can help with. I have an index pattern titled postgres-* and there are two types of records that come back. One type of record includes:

micro_error_count: 2

Another record for that index pattern does not include that field. These records each come in back to back every 1 minute.

When I create a gauge like so:

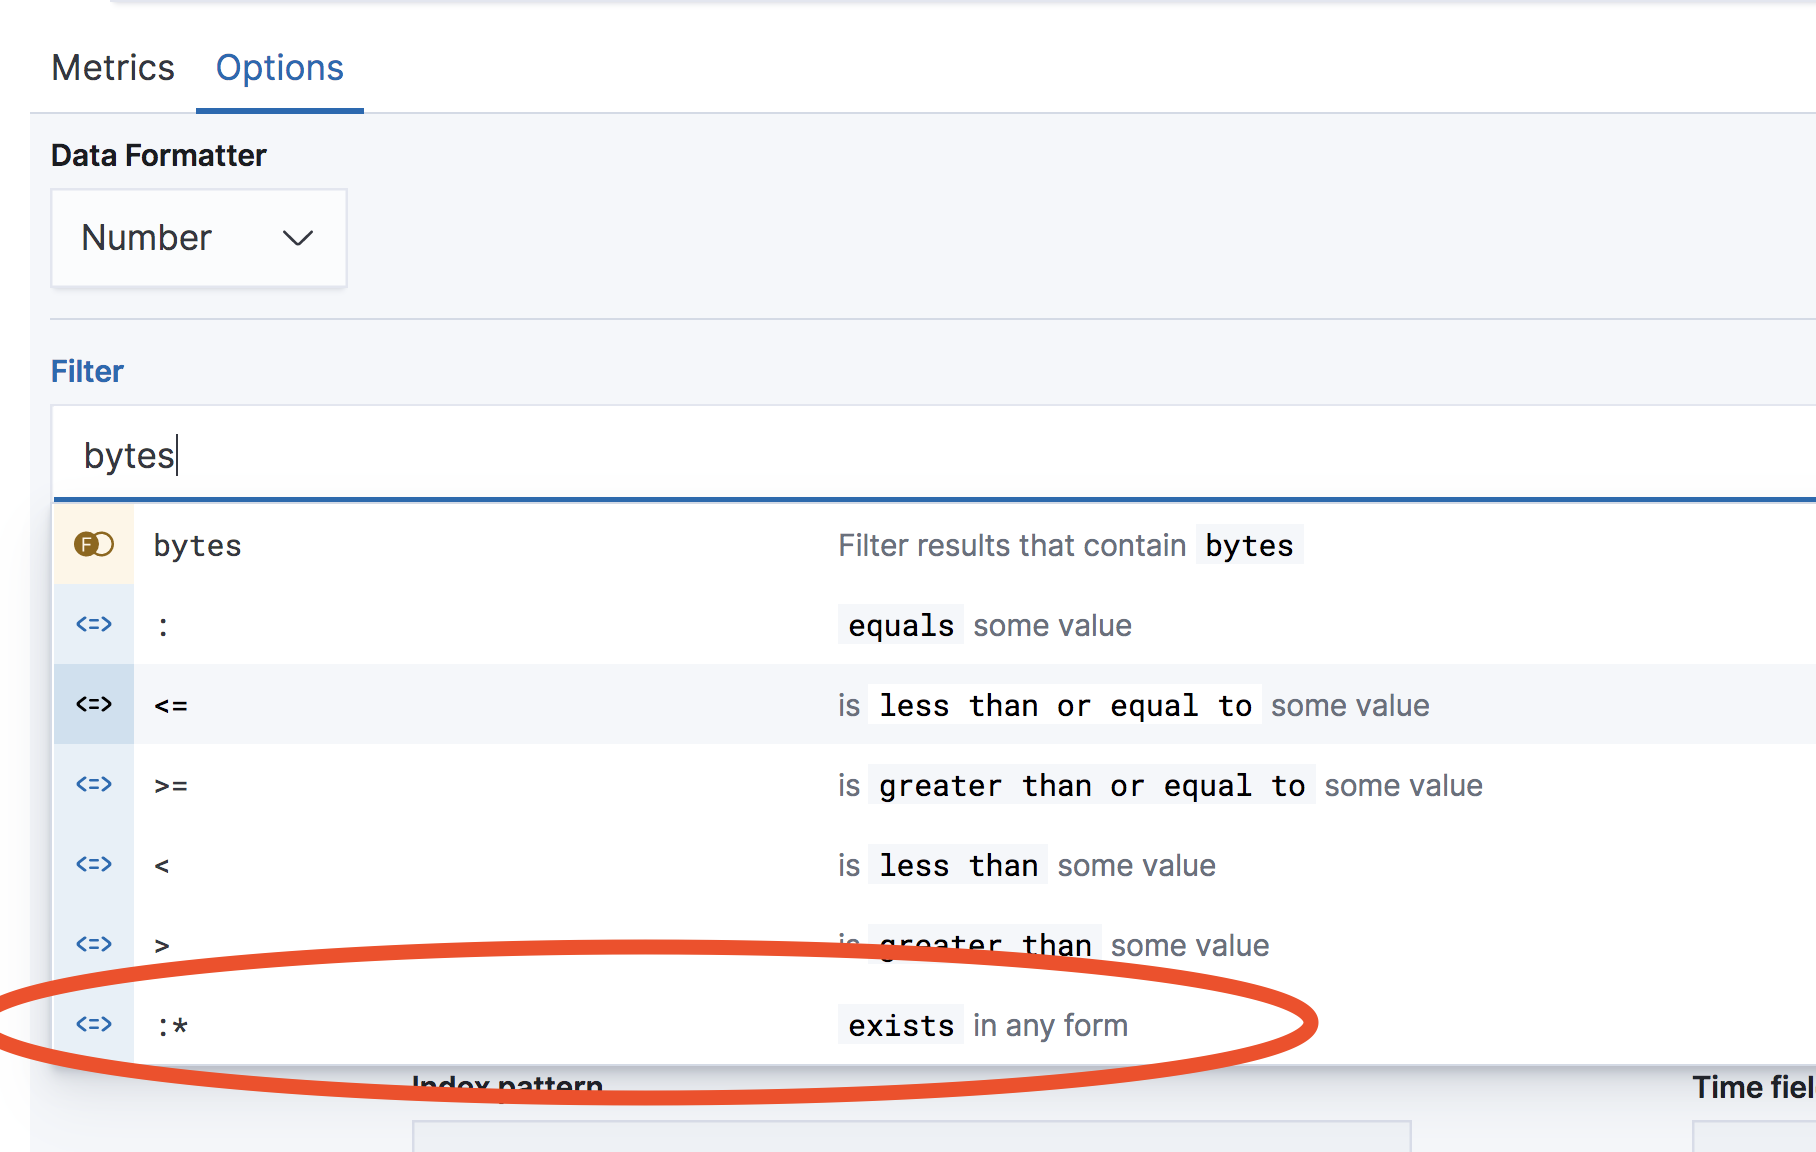
Then sometimes I get back 2, and other times I get back 0 in the gauge. I have tried adding micro_error_count:* to the Panel filter, but no luck there either. I basically want it to only include records from the postgres-* index that contain the key micro_error_count.

Any ideas?

Thanks!

EDIT
I should note that sometimes toggling Drop last bucket will swap between 2 and 0, and sometimes it won't.

I have also tried auto instead of 30m as well as other options and no luck there, either. Same behavior.

TSVG gauge shows the metric value for the last bucket in the time series date histogram. You can adjust this be setting panel options -> Data timerange mode

Thanks for the quick response! Unfortunately this does not solve my issue, though. I need the last bucket for this metric as I need to see the latest value, similar to how the CPU gauge works.

What you show above is aggregating the count, but the problem I have is that I'm averaging the latest value (displaying it) and the last bucket doesn't seem to have the micro_error_count term, and thus the gauge is showing 0.

I'm not sure how to limit the gauge to just records that have that term, since some records from the index don't. Other non-TSVG visualizations seem to filter on if the term exists.

You can use the filter option to filter out documents that do not have a value for a field

This topic was automatically closed 28 days after the last reply. New replies are no longer allowed.