How to change TSVB from an areal chart to a line chart

Hi,
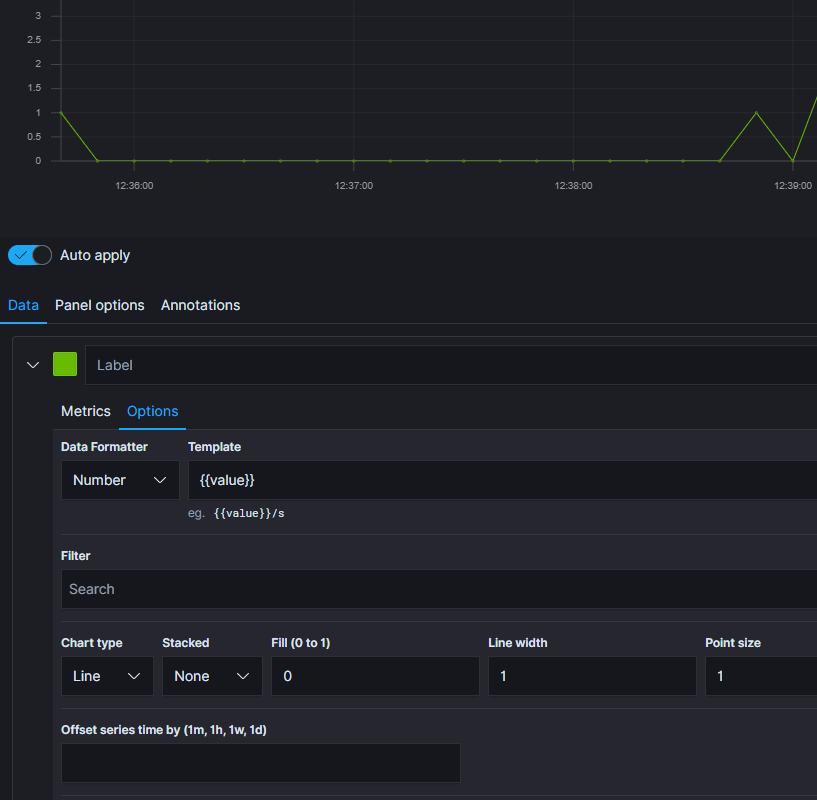
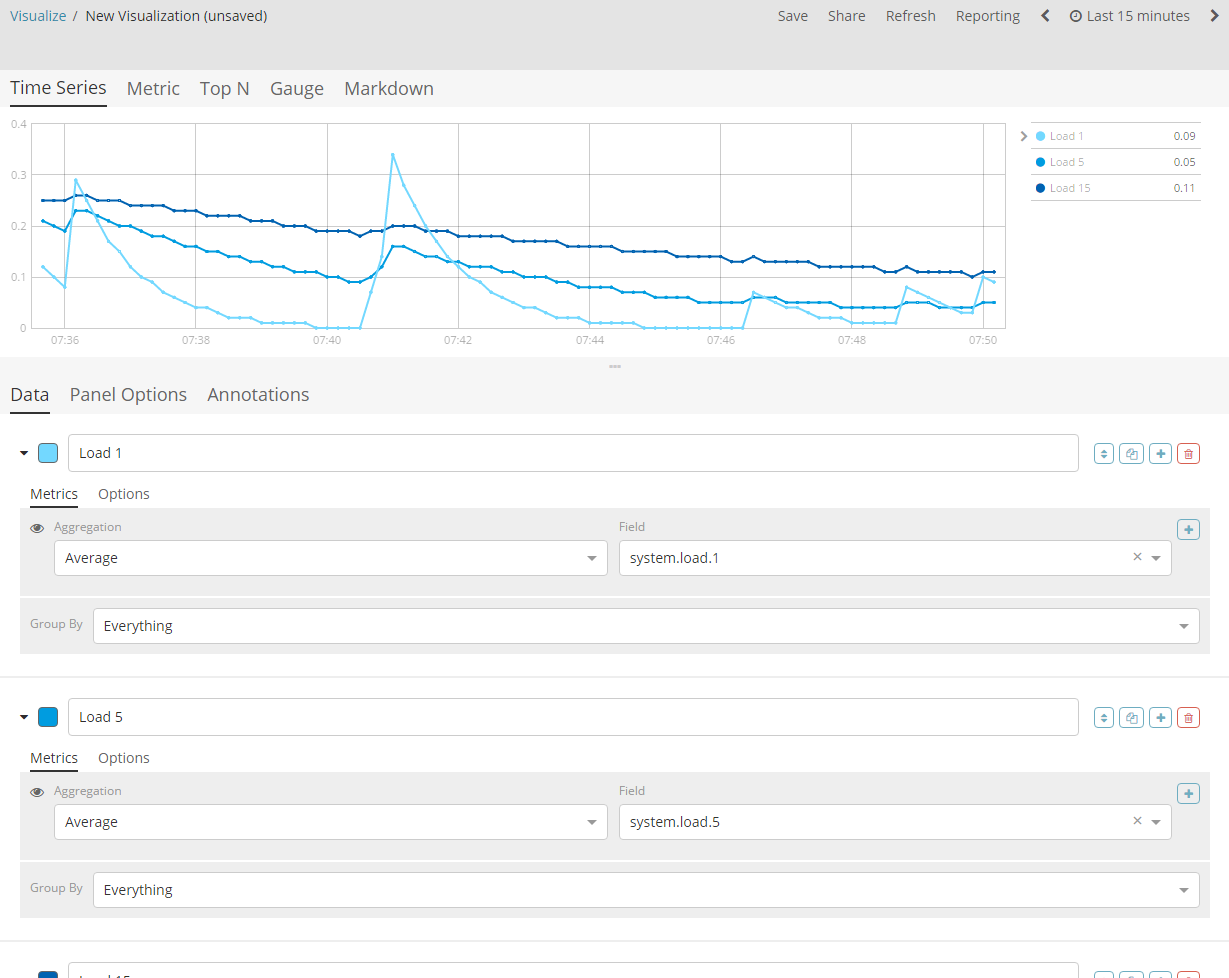
I want to use TSVB for line charts with multiple scales. I got the multiple scales working but it lookes like it is only an areal chart. On the internet I found a picture showing a TSVB line chart:

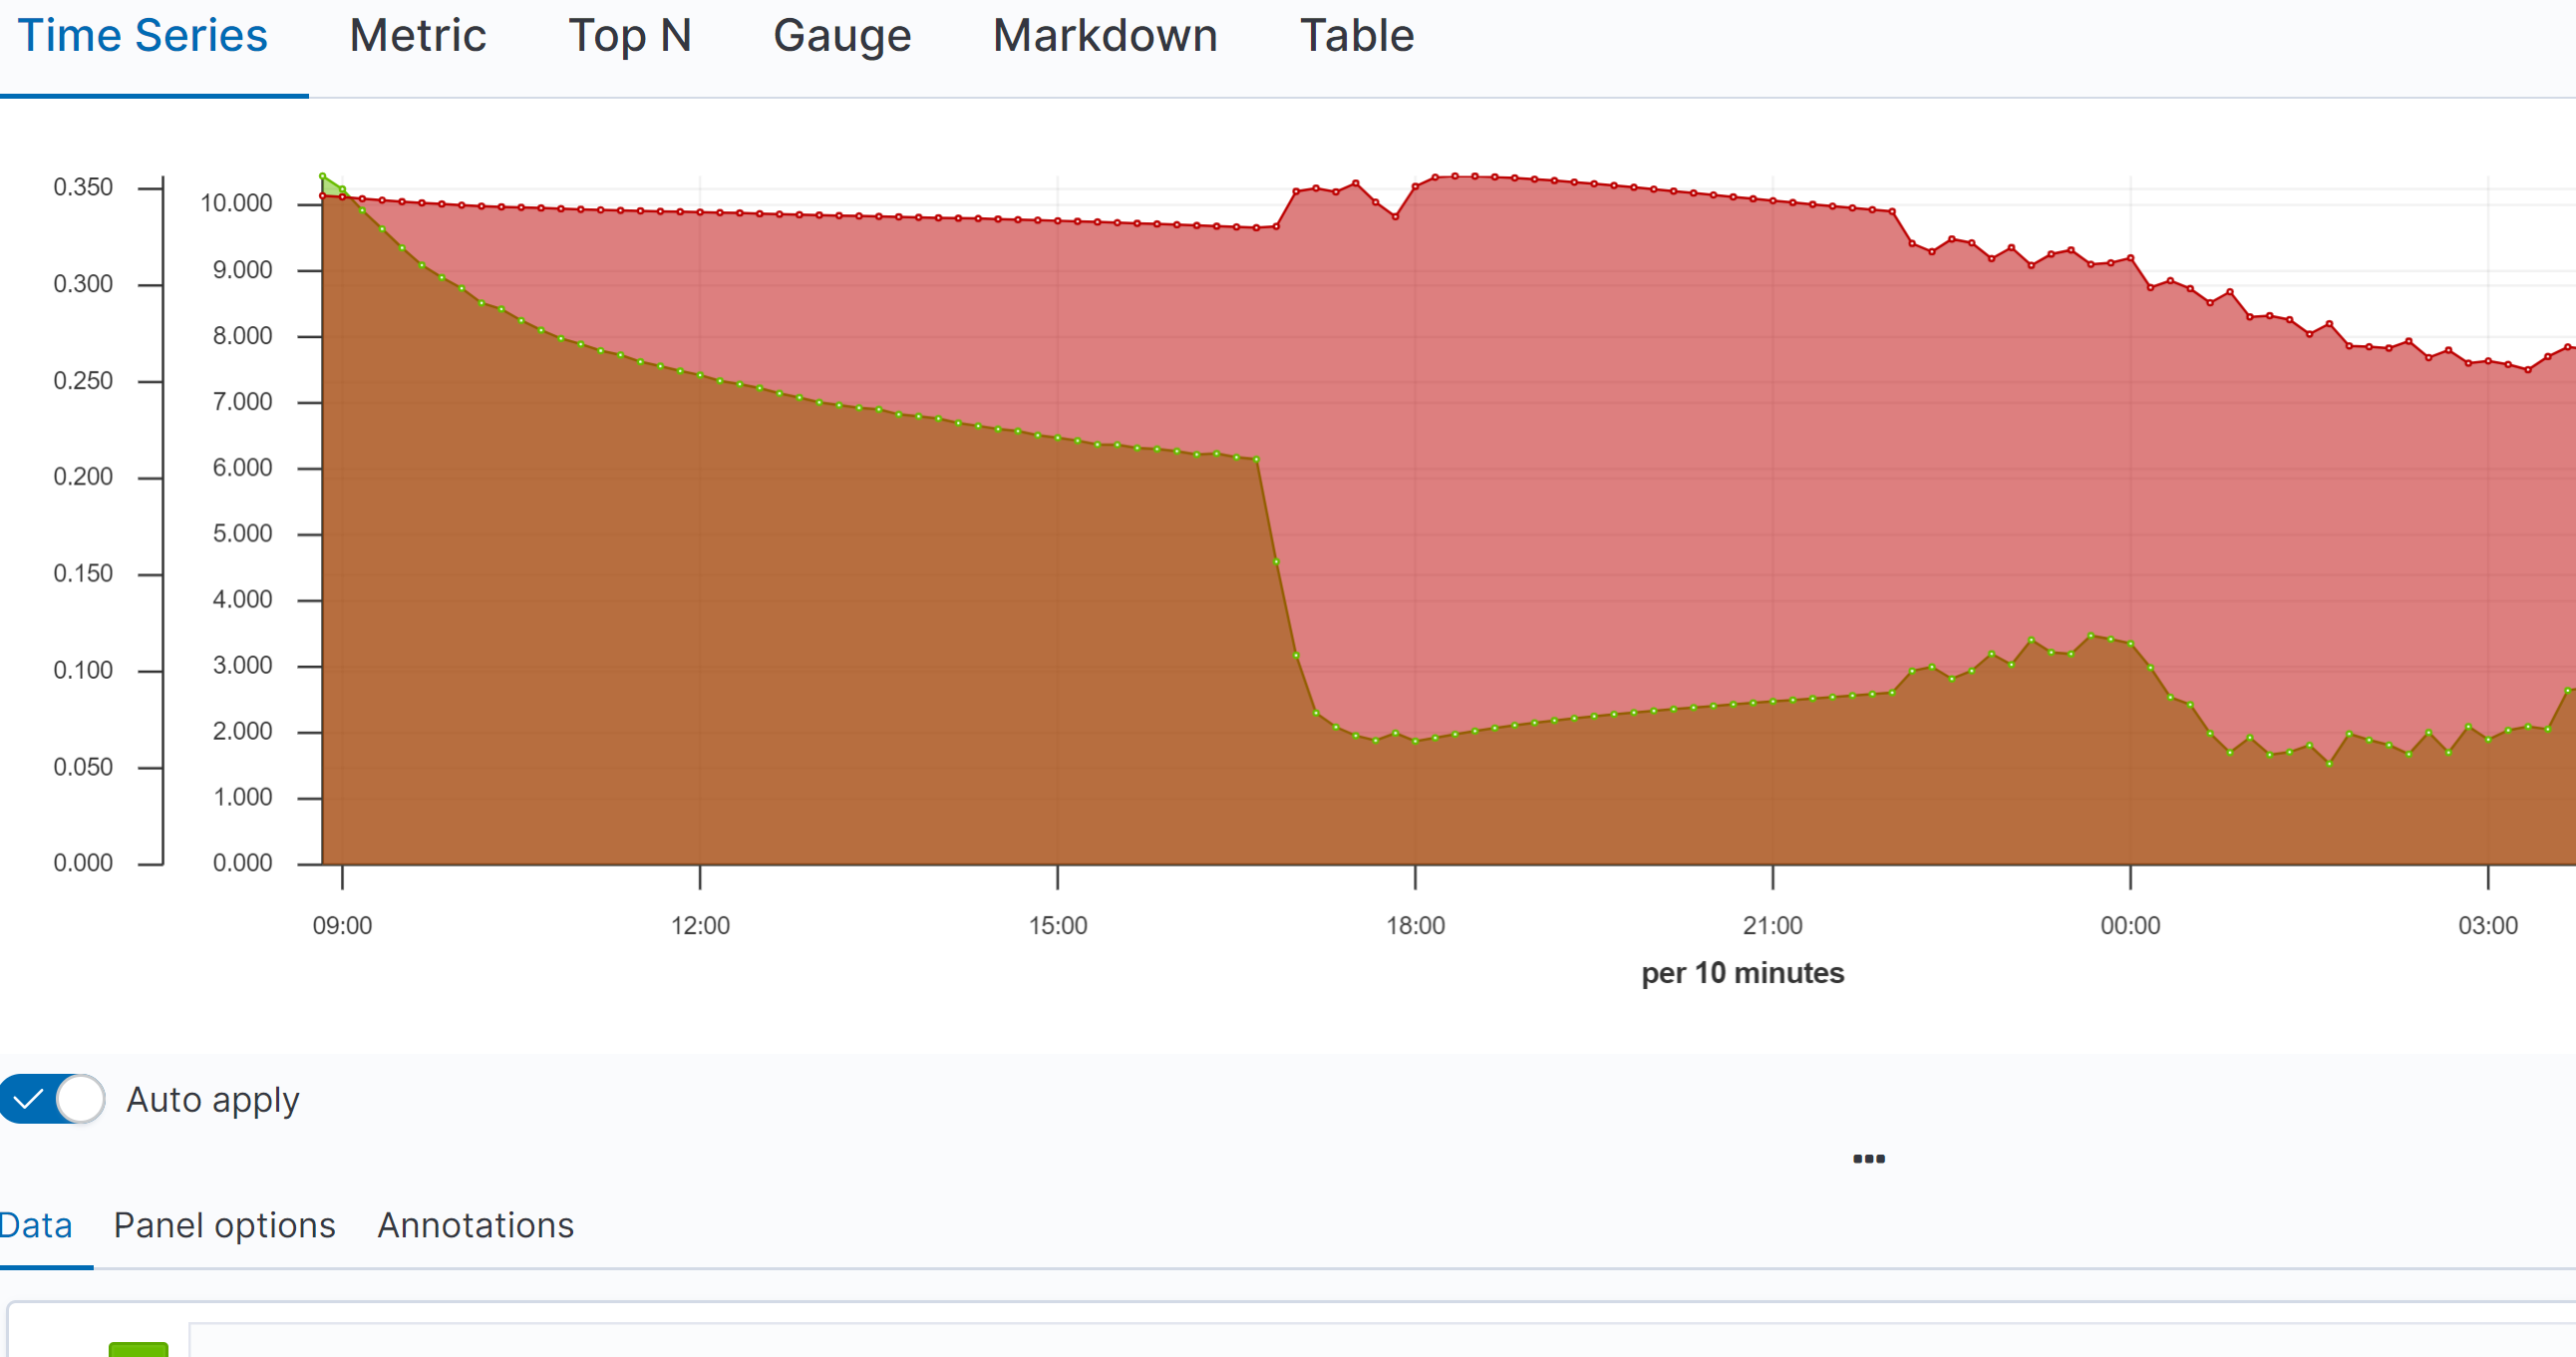
Mine looks like this:

How can I switch?

Thanks, Defalt

1 Like

Under Data :arrow_right: Options :arrow_right: Fill (0 to 1), change this value from 0.5 to 0.

3 Likes

This topic was automatically closed 28 days after the last reply. New replies are no longer allowed.