Hi all,
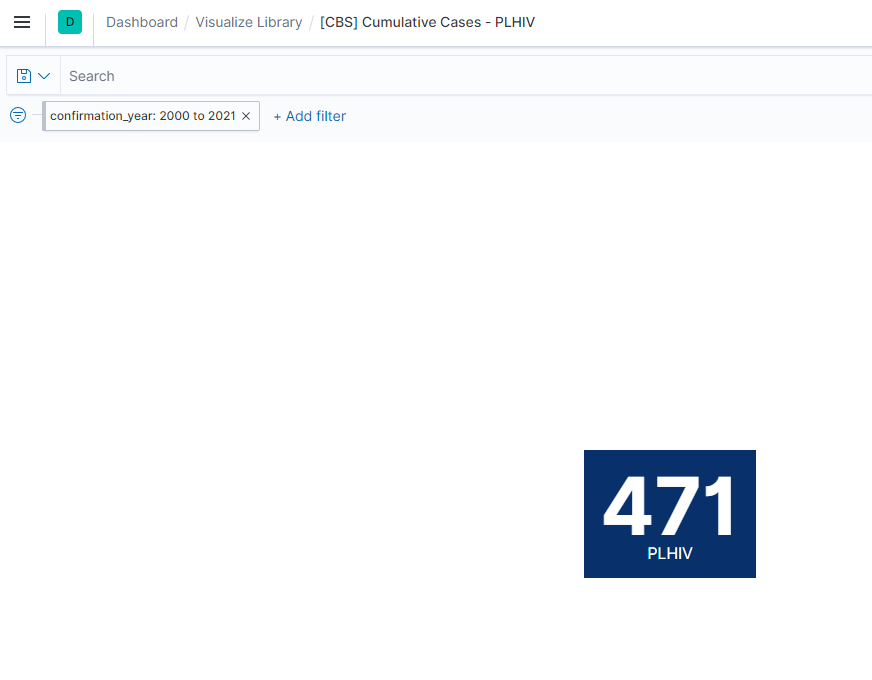
In Dashboard, I have range filter: confirmation_year from A year to B year.
In Elastic have field dead_year.
In metric Visualize , I want to count documents that satisfy the condition: 'dead_year' less than or equal to B year. And change
filter in dashboard (B year) then metric Visualize also change
Thanks all

Welcome to the community @HuongCV!
You could use lens to create Count of records visualization - simply drag Records field to the workspace and choose metric from chart switcher. (you can also use metric from Visualize library)
The filters on the dashboard will be applied to your visualization automatically.
Hi @Marta_Bondyra ,
Thanks for your reply. You misunderstand me. I want to: dashboard filter by range of field 'confirmation_year' (year A to year B), but in metric visualization want filter by 'dead_year' less than or equal to B year and filter 'dead_year' not in dashboard. This mean how to filter on visualization get the parameter (year B) from filter on dashboard.
Thanks
Ok, I see, so you want to make use range control to filter by different fields depends on the visualization. (for Visualize metric control dead_year and for the rest confirmation_year?
I don't think it is possible unfortunately.
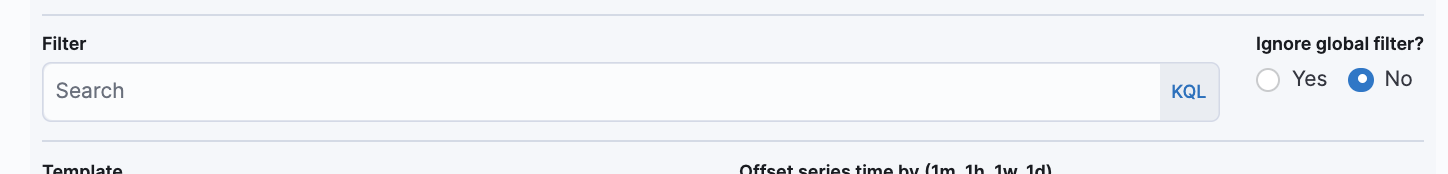
You could use TSVB metric and check the ignore global filter option and add a custom filter about dead_year but that wouldn't allow you to control it from range control.
Hi @Marta_Bondyra
I still want to global filter. My problem is how to get it parameter (year B) of filter range confirmation_year to apply filter dead_year less than or equal to B year in metric visualization.
Thanks