Kiabana graph for total count

Hello, I want to create a graph for following sample input,

Date, Name (can be TCP/UDP or any other), Packets In, Packets Out

This graph will show network throughput of TCP packets, UDP packets and total of TCP and UDP packets.

I am able to create it for TCP and UDP packets. Please refer screenshot.
How to add Total Network Throughput in the graph?

Note: For Network Throughput I have created scripted field in the index.

Here is graph object json

{
"index": "trae-stat",
"query": {
"query_string": {
"query": "name:(udp|tcp)",
"analyze_wildcard": true
}
},
"filter":
}

{
"type": "line",
"params": {
"shareYAxis": true,
"addTooltip": true,
"addLegend": true,
"showCircles": true,
"smoothLines": false,
"interpolate": "linear",
"scale": "linear",
"drawLinesBetweenPoints": true,
"radiusRatio": 9,
"times": ,
"addTimeMarker": false,
"defaultYExtents": false,
"setYExtents": false,
"yAxis": {}
},
"aggs": [
{
"id": "1",
"type": "sum",
"schema": "metric",
"params": {
"field": "nw_thrput"
}
},
{
"id": "2",
"type": "date_histogram",
"schema": "segment",
"params": {
"field": "@timestamp",
"interval": "s",
"customInterval": "2h",
"min_doc_count": 1,
"extended_bounds": {}
}
},
{
"id": "3",
"type": "terms",
"schema": "group",
"params": {
"field": "name",
"size": 5,
"order": "desc",
"orderBy": "1"
}
}
],
"listeners": {}
}

You should be able to click "Add Metrics" under the Y-Axis config and add another metric

So I did that. But problem is, term gets applied to all matrices on Y axis. Like in your snap shot bytes and response fields are grouped by verb.raw field. Instead of this I want to create graph something like,

  1. bytes field grouped by verb.raw
  2. response field as it is. Without grouping.

So my legend(or data plotted) will be ,

  1. GET : Average bytes
  2. HEAD : Average bytes
  3. POST : Average bytes
  4. OPTIONS : Average bytes
  5. Average response

Is it possible?

Gotcha. No, that's not currently possible - interesting suggestion though, please feel free to add to Github:

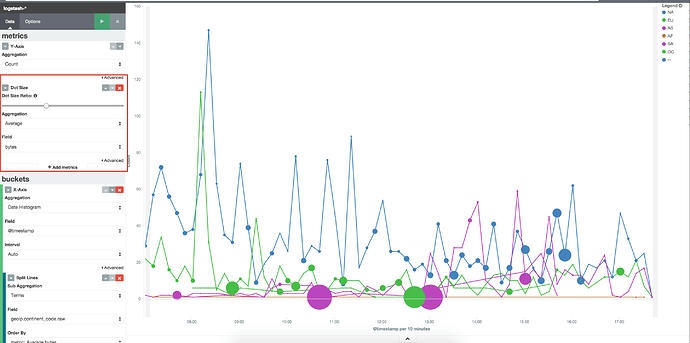
For now, you could consider adding another dimension for #5 though, such as Dot Size in Line Charts (see screenshot). Your other option is to simply plot these on separate charts but put them side-by-side on a dashboard.

Sure Tanya I will try out above suggestions and will raise this issue in Github.

I would like to know next release date of Kibana.

Since Kibana 4.2 is targeted at compatibility with Elasticsearch 2.0, the release timeline will coincide with Elasticsearch 2.0 GA, which is still pending. However, I would expect the beta software for both releases to be available within the next couple of weeks.

Thanks for the update.