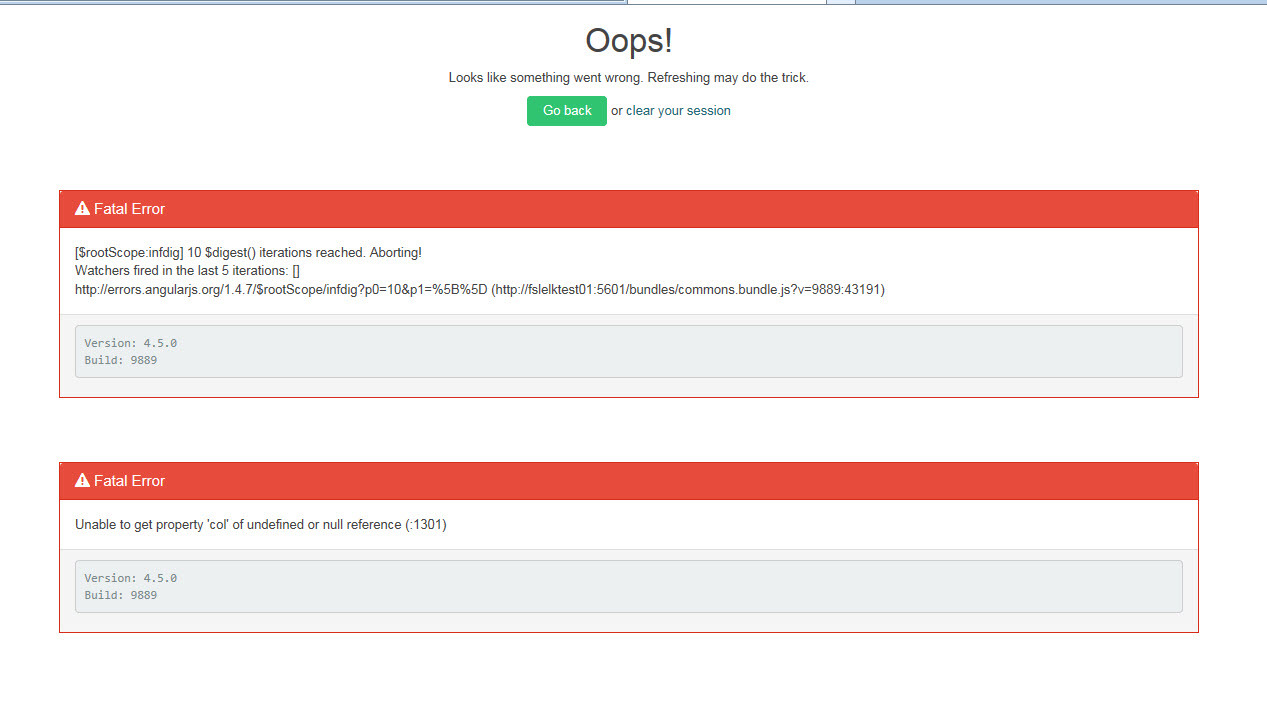
when i use chrome no issue but IE 11, it will show fatal error. Any one know how to fix? btw, this happens when i try to access kibana, not dashboard related.
Does your dashboard have a large amount of visualizations or filters? IE has a url length limit of 2083 characters, and Kibana stores some of this information in your url. If the url becomes too long, Kibana can have issues. We are tracking this at https://github.com/elastic/kibana/issues/6531.
An immediate workaround is to include less visualizations/filters in your dashboard, or to use a different browser.
hi jbudz,
It is confirmed due to this issue as I performed a test with less visualizations in the dashboard and it could open without problem.
Thanks!
Hi,
Currently facing similar issue using Kibana 4.3.1 but on further search seems like a shorten URL feature was rolled out in Kibana 4.4.0, details here # https://www.elastic.co/guide/en/kibana/4.4/releasenotes.html
So does that not work any more in Kibana 4.5.0 ? If yes, this can be fixed using that feature or am missing something pls. ? Just want to be sure, before we plan a upgrade to Kibana 4.4.0.
The shorten url feature unfortunately doesn't fix this - the shortened url will redirect you to the full kibana URL which may have a length > 2083 characters.