Hi there,
To summarize my question : are there any "hidden" parameters than were/can be changed for the "auto" parameter of the time bucket ?
On Kibana 7.7.0, when creating a visualization with the "Line" type, I'm having trouble when using the "auto" option as time interval :
In this particular example my points are generated every 2min (+/- few seconds).
I'm using the average value as Y axis and "date histogram" with "auto" as minimum interval
The problem occurs when I zoom in :
As long as the time buckets are (automatically) set to a value higher than the period of my points, all works fine and the lines are plotted (with "5min" for example)
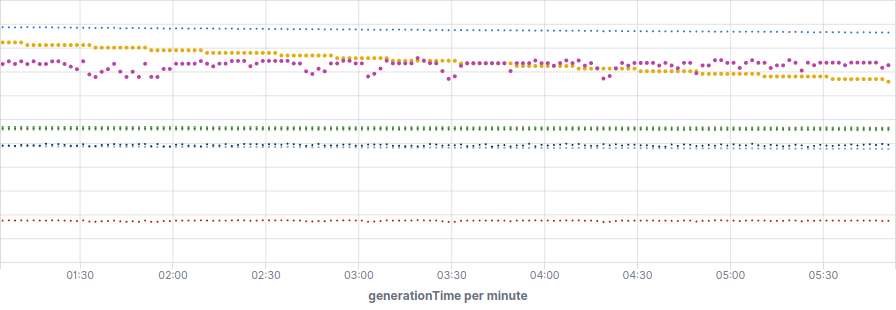
But as soon as the time buckets are (automatically) set to a lower value than the period of my points, only the dots are shown and they are no more connected by a line (with "1min" for example)
As I understand it this is logical because when using 1min buckets, only half of them will contains points whiles the others are empty/null, so that's why the dots are not connected.
However, in previous versions, the "auto" parameter was less "aggressive" : when multiple hours were display it was not set to 1min
I could set the "minimum interval" to 2min, sure, but as this interval change from day to day I would like to avoid to manually change this, thus using the "auto" parameter.
So, is there a way to make Kibana "auto" parameter an order of magnitude less "aggressive" so than when multiple hours are displayed it stays at 10min instead of 1min ?
On the example below a slight zoom change the auto parameter from 5min to 1min and make the lines disappear