I want to use the [Metrics System] Overview stock dashboard from Metricbeat as a source.
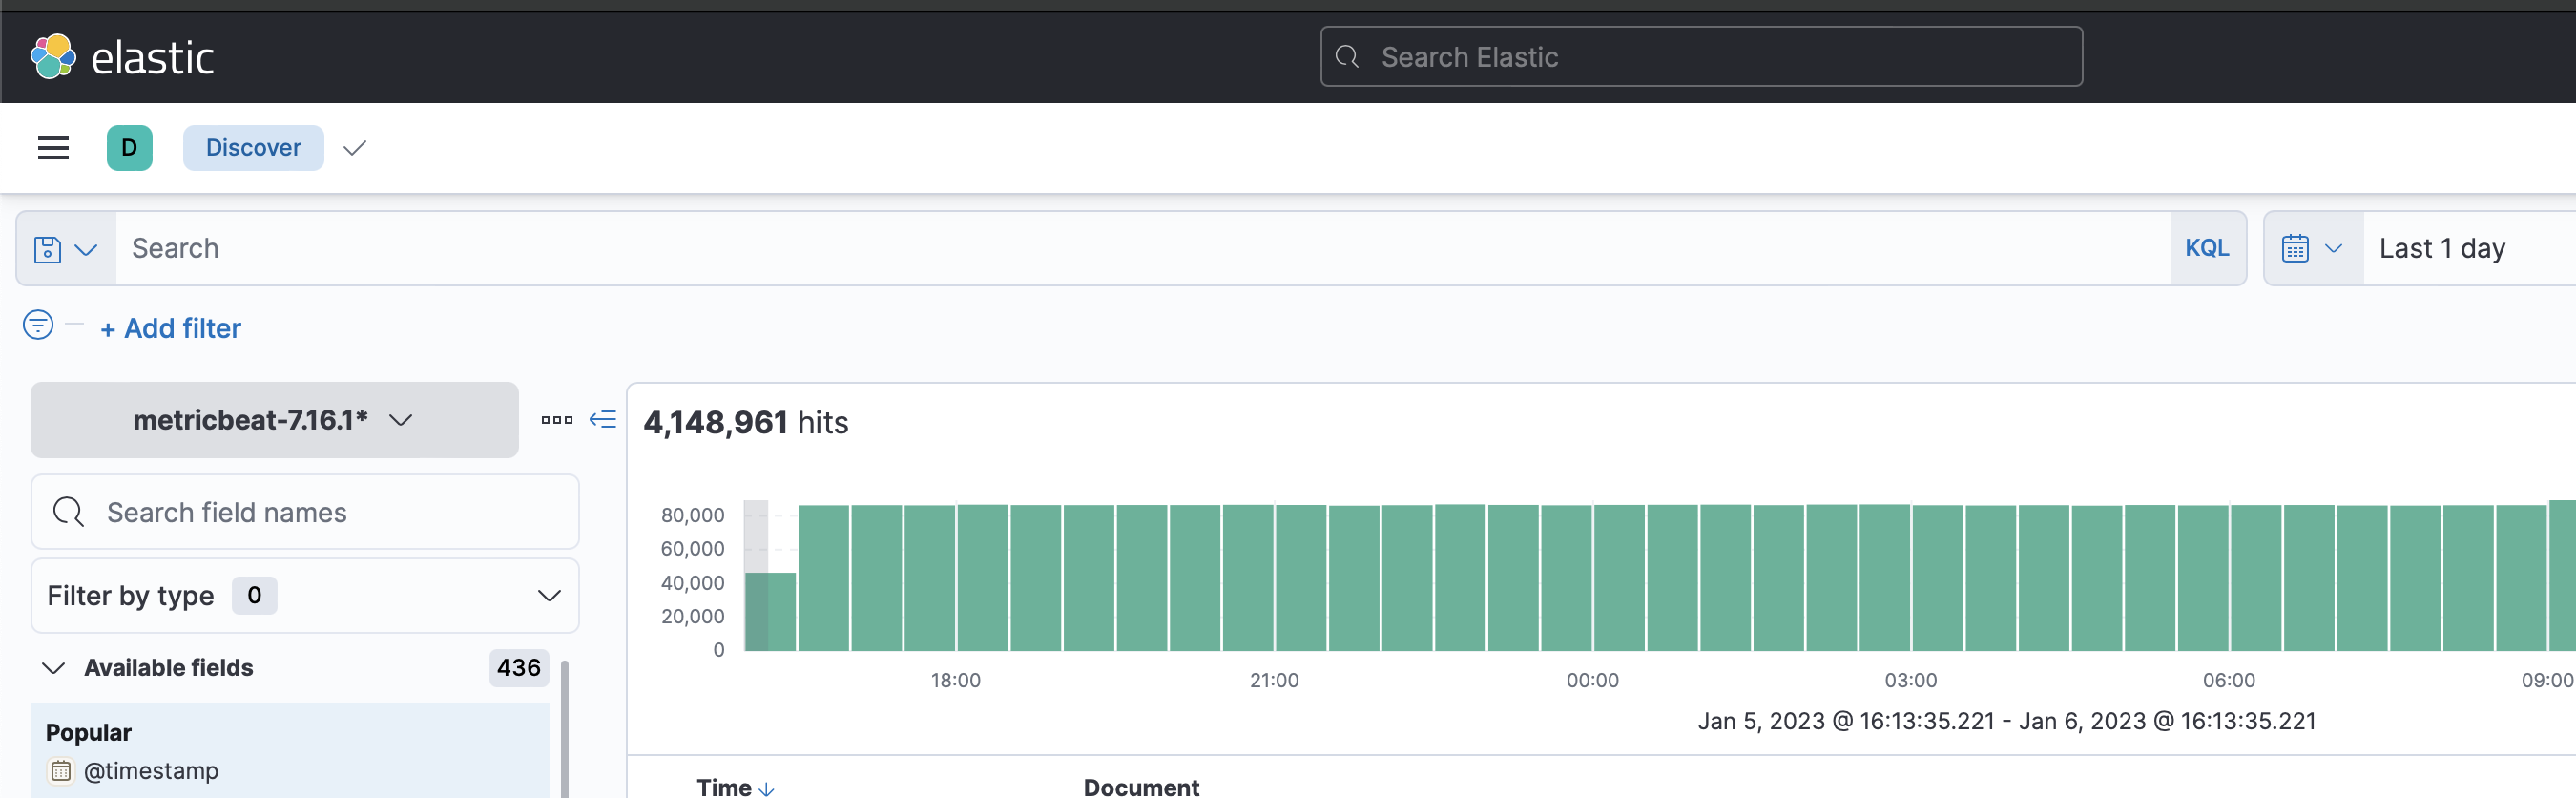
But it's empty, even when I use metricbeat-* index pattern as default.
How can I change the index for such visualizations?
@tsykorii try to query the logs in Discover with the same search and fields in your metrics-* pattern and see if you get any result for the defined timeline. Also, if you expand the buckets in visualizations of the dashboard, it will show if there are any errors in it (may be the filed name is different, etc.).
Agree, but how can I switch the visualisations to an another (metricbeat-* in my case) index pattern? I can't for [Metrics System] Overview stock dashboard.
Do I need to create my own custom dashboard, is this the only way?
The simplest way would be to export the dashboard as JSON with child elements included, replace metric-* with metricbeat-* and import the JSON with replace existing objects option enabled. This all can be done from Kibana -> Stack Management, there's an option for Manage Saved Objects: Manage saved objects | Kibana Guide [8.5] | Elastic
Apache, Apache Lucene, Apache Hadoop, Hadoop, HDFS and the yellow elephant
logo are trademarks of the
Apache Software Foundation
in the United States and/or other countries.