I have setup my ELK stack (pretty much as per as on DigitalOcean guide and its mostly working ok.
Except graphing over time, I want to view things like graph response over time.
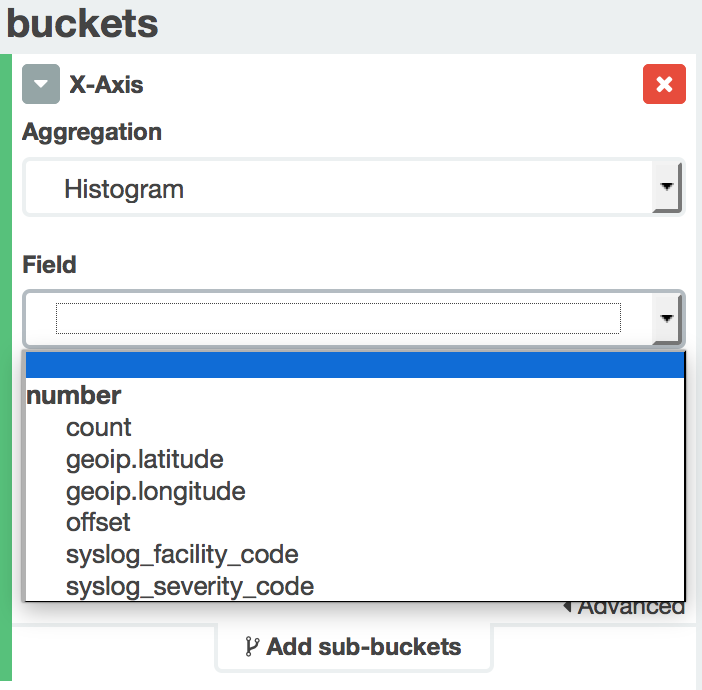
But looking at some guides, it seems I don't have "buckets" setup correctly?
Date and Date Historgram show very few Fields, of which I think there should be more right?
The same for Data Range Aggregation as well.

Would anyone be able to help me figure out whats wrong?
If I understand correctly, you're trying to graph response time over time. I'm not familiar with that tutorial in particular, but what you're trying to do is pretty straight forward.
First, let's look at the buckets. You're right that you want to use Date Histogram for the x-axis. Do so, and select your time field. The reason you only see a couple fields here is because date aggregations can only be done on date fields, so only date fields are shown - using another field type will result in an error response from Elasticsearch. Check your mappings in the index pattern settings screen, it might help this make more sense.
Now, you're looking for the response time, not the count, so you'll need a different metric as well. It's important to understand that you are asking Elasticsearch for aggregate data, and not specific documents. So, you'll have to decide what metric or metrics you care about. Average, median, total, percentile, it's totally up to you, and you can add as many as you'd like (though, too many on the same graph will make it very noisy and possibly unusable).
Hopefully I understood what you're trying to do correctly, and that this helps you understand how to do it.