Observability Overview - Logs not shown as log source

Hi

Running Kibana version: 8.14.3

I'm trying to show my "log sources" via the Observability Overview screen. It contains a via view: Log Events > Logs rate per minute

I assume this is the required config:

Although I have the below fields, it is still not shown:

  • @timestamp
  • message
  • event.dataset
  • host.hostname
  • host.name
  • container.id
  • service.name

Are there any requirements on field types? I converted already most of them from text to keyword.

Logs are popping up fine via stream & explorer (both under Observability > Logs).

Anyone who has an idea on how to show my log sources in the Overview screen?

Thanks!
Christof

Extra info: Logs are neither shown as "unknown". So really just absent in the overview screen..

Sample log & in the background you see +20.000 logs available but not shown above in the overview.

No one who knows how this works?

I set up a separate stack via Docker for testing purposes:
It seems that the field responsible for "count" is giving issues:

Still need to proceed my testing what is causing this behavior.. :slight_smile:

REMARK: Strange thing is that even if I only configure my jboss index in the original set up, it does not show the "unknown" source

I just found out that the time window also plays a role:


Same "Jboss" source, but counted:

And using a different time filter, I can show the bar but I'm missing the count on top:

New observation:

Events:

Event - additional host fields:

Got an even more bizar scenario..

Only 1 event:

But "Log Events" is able to count "2", bar is missing again:

Hi @chouben

I am not following all this but I can say some things are not correct. I am not sure how you are ingesting the logs, how if / you create index templates

I think you need to read this to understand data stream naming conventions even of you are not using agent these concepts still hold.

When I look below your data stream is

logs-debug-test

Which should be

type: logs
datastream: debug
namespace: test 

But some reason you have set the values differently and that is not good / best practice.

So how are you ingest? A

These are all ECS fields and the mapping should be automatically mapped for you

if you run the commands below you should see the fields you want to be mapped correctly so I am not sure how you are ingesting

DELETE _data_stream/logs-debug-test/

GET logs-debug-test/

POST logs-debug-test/_doc
{
  "@timestamp": "2024-10-10T23:40:04.279Z",
  "message" : "my log message",
  "data_stream" : {
    "dataset" : "debug",
    "namespace" : "test"
  },
  "event" : {
    "dataset" : "mycustomlogs"
  },
  "host" : {
    "name" : "myhost",
    "hostname" : "myhostname"
  },
  "container" : {
    "id" : "12345-345876"
  },
  "service" :{ "name" : "myservice"}
}


GET logs-debug-test/_search

GET logs-debug-test/

Hi @stephenb

Good catch, but I'm simply sending in the test cases with below code via dev console:

POST /logs-debug-test/_doc
{
    "message": "Starting up Elasticsearch",
    "event": {
      "dataset": "jboss"
    },
    "level": "debug",
    "host": {
      "hostname": "xxxxxxmon01",
      "name": "xxxxxxmon01"
    }
  }

So not sure why elastic is mapping to an incorrect datastream field :thinking: It seems that I "broke" it during my testing.. Might be related to a different message I recovered from the operational stack, where I forgot to remove the data_stream part.

After dropping the existing datastream, this is how my message looks like:

Last 15 minutes:

8:14-8:20

So there is still some issue with the counting. I'll get back to your sample case now..

Best regards
Christof

Running your test case in 18.4.3:

I removed the datastream so everything is created from scratch.
I also removed the "@timestamp" to have recent & unique timestamps.

POST logs-debug-test/_doc
{
  "message" : "my log message",
  "data_stream" : {
    "dataset" : "debug",
    "namespace" : "test"
  },
  "event" : {
    "dataset" : "mycustomlogs"
  },
  "host" : {
    "name" : "myhost",
    "hostname" : "myhostname"
  },
  "container" : {
    "id" : "12345-345876"
  },
  "service" :{ "name" : "myservice"}
}

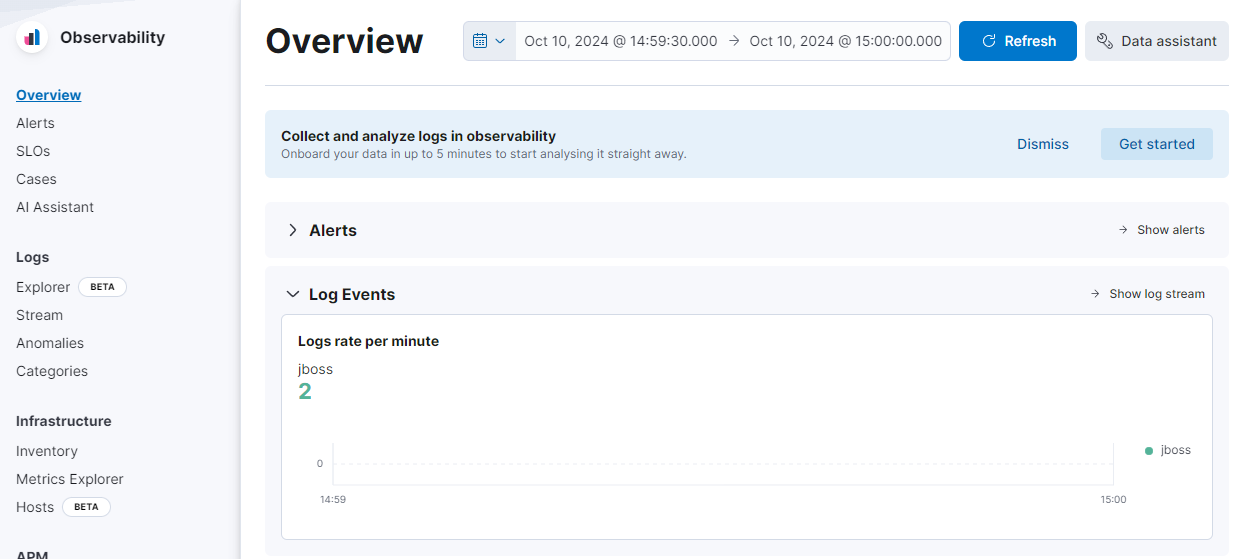
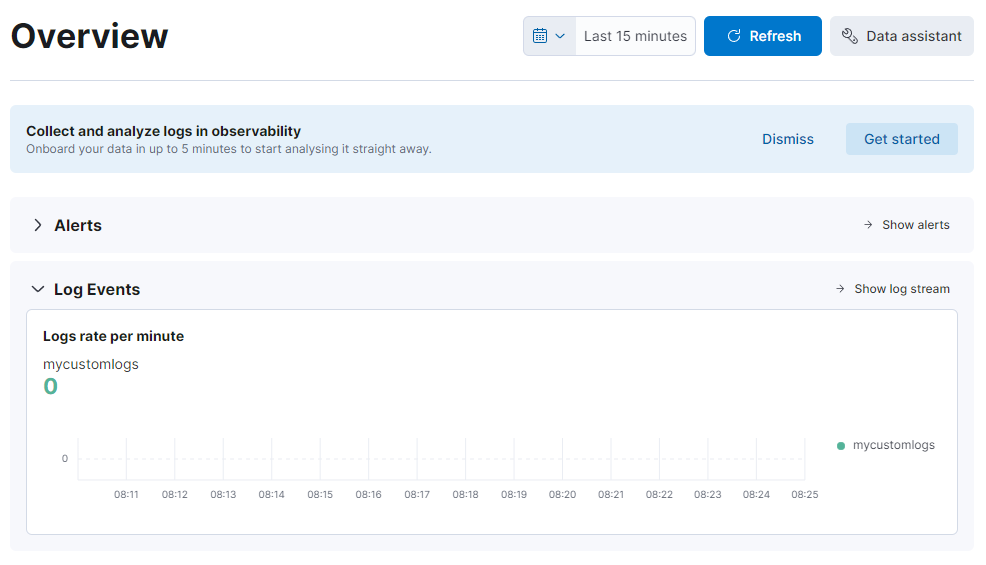
After sending in, it look like:

Result is still the same @stephenb :

Data stream with default logs index template:

GET /_data_stream/logs-debug-test/

{
  "data_streams": [
    {
      "name": "logs-debug-test",
      "timestamp_field": {
        "name": "@timestamp"
      },
      "indices": [
        {
          "index_name": ".ds-logs-debug-test-2024.10.11-000001",
          "index_uuid": "bloEyFieQUyiu6a5t5IYLQ",
          "prefer_ilm": true,
          "ilm_policy": "logs",
          "managed_by": "Index Lifecycle Management"
        }
      ],
      "generation": 1,
      "_meta": {
        "managed": true,
        "description": "default logs template installed by x-pack"
      },
      "status": "YELLOW",
      "template": "logs",
      "ilm_policy": "logs",
      "next_generation_managed_by": "Index Lifecycle Management",
      "prefer_ilm": true,
      "hidden": false,
      "system": false,
      "allow_custom_routing": false,
      "replicated": false,
      "rollover_on_write": false
    }
  ]
}

Index

GET logs-debug-test/

{
  ".ds-logs-debug-test-2024.10.11-000001": {
    "aliases": {},
    "mappings": {
      "_data_stream_timestamp": {
        "enabled": true
      },
      "dynamic_templates": [
        {
          "ecs_timestamp": {
            "match": "@timestamp",
            "mapping": {
              "ignore_malformed": false,
              "type": "date"
            }
          }
        },
        {
          "ecs_message_match_only_text": {
            "path_match": [
              "message",
              "*.message"
            ],
            "unmatch_mapping_type": "object",
            "mapping": {
              "type": "match_only_text"
            }
          }
        },
        {
          "ecs_non_indexed_keyword": {
            "path_match": "event.original",
            "mapping": {
              "doc_values": false,
              "index": false,
              "type": "keyword"
            }
          }
        },
        {
          "ecs_non_indexed_long": {
            "path_match": "*.x509.public_key_exponent",
            "mapping": {
              "doc_values": false,
              "index": false,
              "type": "long"
            }
          }
        },
        {
          "ecs_ip": {
            "path_match": [
              "ip",
              "*.ip",
              "*_ip"
            ],
            "match_mapping_type": "string",
            "mapping": {
              "type": "ip"
            }
          }
        },
        {
          "ecs_wildcard": {
            "path_match": [
              "*.io.text",
              "*.message_id",
              "*registry.data.strings",
              "*url.path"
            ],
            "unmatch_mapping_type": "object",
            "mapping": {
              "type": "wildcard"
            }
          }
        },
        {
          "ecs_path_match_wildcard_and_match_only_text": {
            "path_match": [
              "*.body.content",
              "*url.full",
              "*url.original"
            ],
            "unmatch_mapping_type": "object",
            "mapping": {
              "fields": {
                "text": {
                  "type": "match_only_text"
                }
              },
              "type": "wildcard"
            }
          }
        },
        {
          "ecs_match_wildcard_and_match_only_text": {
            "match": [
              "*command_line",
              "*stack_trace"
            ],
            "unmatch_mapping_type": "object",
            "mapping": {
              "fields": {
                "text": {
                  "type": "match_only_text"
                }
              },
              "type": "wildcard"
            }
          }
        },
        {
          "ecs_path_match_keyword_and_match_only_text": {
            "path_match": [
              "*.title",
              "*.executable",
              "*.name",
              "*.working_directory",
              "*.full_name",
              "*file.path",
              "*file.target_path",
              "*os.full",
              "email.subject",
              "vulnerability.description",
              "user_agent.original"
            ],
            "unmatch_mapping_type": "object",
            "mapping": {
              "fields": {
                "text": {
                  "type": "match_only_text"
                }
              },
              "type": "keyword"
            }
          }
        },
        {
          "ecs_date": {
            "path_match": [
              "*.timestamp",
              "*_timestamp",
              "*.not_after",
              "*.not_before",
              "*.accessed",
              "created",
              "*.created",
              "*.installed",
              "*.creation_date",
              "*.ctime",
              "*.mtime",
              "ingested",
              "*.ingested",
              "*.start",
              "*.end"
            ],
            "unmatch_mapping_type": "object",
            "mapping": {
              "type": "date"
            }
          }
        },
        {
          "ecs_path_match_float": {
            "path_match": [
              "*.score.*",
              "*_score*"
            ],
            "path_unmatch": "*.version",
            "unmatch_mapping_type": "object",
            "mapping": {
              "type": "float"
            }
          }
        },
        {
          "ecs_usage_double_scaled_float": {
            "path_match": "*.usage",
            "match_mapping_type": [
              "double",
              "long",
              "string"
            ],
            "mapping": {
              "scaling_factor": 1000,
              "type": "scaled_float"
            }
          }
        },
        {
          "ecs_geo_point": {
            "path_match": [
              "location",
              "*.location"
            ],
            "mapping": {
              "type": "geo_point"
            }
          }
        },
        {
          "ecs_flattened": {
            "path_match": [
              "*structured_data",
              "*exports",
              "*imports"
            ],
            "match_mapping_type": "object",
            "mapping": {
              "type": "flattened"
            }
          }
        },
        {
          "all_strings_to_keywords": {
            "match_mapping_type": "string",
            "mapping": {
              "ignore_above": 1024,
              "type": "keyword"
            }
          }
        }
      ],
      "date_detection": false,
      "properties": {
        "@timestamp": {
          "type": "date",
          "ignore_malformed": false
        },
        "container": {
          "properties": {
            "id": {
              "type": "keyword",
              "ignore_above": 1024
            }
          }
        },
        "data_stream": {
          "properties": {
            "dataset": {
              "type": "constant_keyword",
              "value": "debug"
            },
            "namespace": {
              "type": "constant_keyword",
              "value": "test"
            },
            "type": {
              "type": "constant_keyword",
              "value": "logs"
            }
          }
        },
        "event": {
          "properties": {
            "dataset": {
              "type": "keyword",
              "ignore_above": 1024
            }
          }
        },
        "host": {
          "properties": {
            "hostname": {
              "type": "keyword",
              "ignore_above": 1024
            },
            "name": {
              "type": "keyword",
              "fields": {
                "text": {
                  "type": "match_only_text"
                }
              }
            }
          }
        },
        "message": {
          "type": "match_only_text"
        },
        "service": {
          "properties": {
            "name": {
              "type": "keyword",
              "fields": {
                "text": {
                  "type": "match_only_text"
                }
              }
            }
          }
        }
      }
    },
    "settings": {
      "index": {
        "lifecycle": {
          "name": "logs"
        },
        "codec": "best_compression",
        "routing": {
          "allocation": {
            "include": {
              "_tier_preference": "data_hot"
            }
          }
        },
        "mapping": {
          "total_fields": {
            "ignore_dynamic_beyond_limit": "true"
          },
          "ignore_malformed": "true"
        },
        "hidden": "true",
        "number_of_shards": "1",
        "provided_name": ".ds-logs-debug-test-2024.10.11-000001",
        "default_pipeline": "logs@default-pipeline",
        "creation_date": "1728627754279",
        "number_of_replicas": "1",
        "uuid": "bloEyFieQUyiu6a5t5IYLQ",
        "version": {
          "created": "8505000"
        }
      }
    },
    "data_stream": "logs-debug-test"
  }
}

Best regards
Christof

Using my 8.15.2 stack:

Same message:

POST logs-debug-test/_doc
{
  "message" : "my log message",
  "data_stream" : {
    "dataset" : "debug",
    "namespace" : "test"
  },
  "event" : {
    "dataset" : "mycustomlogs"
  },
  "host" : {
    "name" : "myhost",
    "hostname" : "myhostname"
  },
  "container" : {
    "id" : "12345-345876"
  },
  "service" :{ "name" : "myservice"}
}

Which looks like:

Result is the same:

Data stream with logs template:

GET /_data_stream/logs-debug-test/

{
  "data_streams": [
    {
      "name": "logs-debug-test",
      "timestamp_field": {
        "name": "@timestamp"
      },
      "indices": [
        {
          "index_name": ".ds-logs-debug-test-2024.10.11-000001",
          "index_uuid": "ApyItpxBQPSTnqwXWok9Dg",
          "prefer_ilm": true,
          "ilm_policy": "logs",
          "managed_by": "Index Lifecycle Management"
        }
      ],
      "generation": 1,
      "_meta": {
        "description": "default logs template installed by x-pack",
        "managed": true
      },
      "status": "YELLOW",
      "template": "logs",
      "ilm_policy": "logs",
      "next_generation_managed_by": "Index Lifecycle Management",
      "prefer_ilm": true,
      "hidden": false,
      "system": false,
      "allow_custom_routing": false,
      "replicated": false,
      "rollover_on_write": false
    }
  ]
}

Index:

GET logs-debug-test/

{
  ".ds-logs-debug-test-2024.10.11-000001": {
    "aliases": {},
    "mappings": {
      "_data_stream_timestamp": {
        "enabled": true
      },
      "dynamic_templates": [
        {
          "ecs_timestamp": {
            "match": "@timestamp",
            "mapping": {
              "ignore_malformed": false,
              "type": "date"
            }
          }
        },
        {
          "ecs_message_match_only_text": {
            "path_match": [
              "message",
              "*.message"
            ],
            "unmatch_mapping_type": "object",
            "mapping": {
              "type": "match_only_text"
            }
          }
        },
        {
          "ecs_non_indexed_keyword": {
            "path_match": "event.original",
            "mapping": {
              "doc_values": false,
              "index": false,
              "type": "keyword"
            }
          }
        },
        {
          "ecs_non_indexed_long": {
            "path_match": "*.x509.public_key_exponent",
            "mapping": {
              "doc_values": false,
              "index": false,
              "type": "long"
            }
          }
        },
        {
          "ecs_ip": {
            "path_match": [
              "ip",
              "*.ip",
              "*_ip"
            ],
            "match_mapping_type": "string",
            "mapping": {
              "type": "ip"
            }
          }
        },
        {
          "ecs_wildcard": {
            "path_match": [
              "*.io.text",
              "*.message_id",
              "*registry.data.strings",
              "*url.path"
            ],
            "unmatch_mapping_type": "object",
            "mapping": {
              "type": "wildcard"
            }
          }
        },
        {
          "ecs_path_match_wildcard_and_match_only_text": {
            "path_match": [
              "*.body.content",
              "*url.full",
              "*url.original"
            ],
            "unmatch_mapping_type": "object",
            "mapping": {
              "fields": {
                "text": {
                  "type": "match_only_text"
                }
              },
              "type": "wildcard"
            }
          }
        },
        {
          "ecs_match_wildcard_and_match_only_text": {
            "match": [
              "*command_line",
              "*stack_trace"
            ],
            "unmatch_mapping_type": "object",
            "mapping": {
              "fields": {
                "text": {
                  "type": "match_only_text"
                }
              },
              "type": "wildcard"
            }
          }
        },
        {
          "ecs_path_match_keyword_and_match_only_text": {
            "path_match": [
              "*.title",
              "*.executable",
              "*.name",
              "*.working_directory",
              "*.full_name",
              "*file.path",
              "*file.target_path",
              "*os.full",
              "email.subject",
              "vulnerability.description",
              "user_agent.original"
            ],
            "unmatch_mapping_type": "object",
            "mapping": {
              "fields": {
                "text": {
                  "type": "match_only_text"
                }
              },
              "type": "keyword"
            }
          }
        },
        {
          "ecs_date": {
            "path_match": [
              "*.timestamp",
              "*_timestamp",
              "*.not_after",
              "*.not_before",
              "*.accessed",
              "created",
              "*.created",
              "*.installed",
              "*.creation_date",
              "*.ctime",
              "*.mtime",
              "ingested",
              "*.ingested",
              "*.start",
              "*.end",
              "*.indicator.first_seen",
              "*.indicator.last_seen",
              "*.indicator.modified_at",
              "*threat.enrichments.matched.occurred"
            ],
            "unmatch_mapping_type": "object",
            "mapping": {
              "type": "date"
            }
          }
        },
        {
          "ecs_path_match_float": {
            "path_match": [
              "*.score.*",
              "*_score*"
            ],
            "path_unmatch": "*.version",
            "unmatch_mapping_type": "object",
            "mapping": {
              "type": "float"
            }
          }
        },
        {
          "ecs_usage_double_scaled_float": {
            "path_match": "*.usage",
            "match_mapping_type": [
              "double",
              "long",
              "string"
            ],
            "mapping": {
              "scaling_factor": 1000,
              "type": "scaled_float"
            }
          }
        },
        {
          "ecs_geo_point": {
            "path_match": "*.geo.location",
            "mapping": {
              "type": "geo_point"
            }
          }
        },
        {
          "ecs_flattened": {
            "path_match": [
              "*structured_data",
              "*exports",
              "*imports"
            ],
            "match_mapping_type": "object",
            "mapping": {
              "type": "flattened"
            }
          }
        },
        {
          "all_strings_to_keywords": {
            "match_mapping_type": "string",
            "mapping": {
              "ignore_above": 1024,
              "type": "keyword"
            }
          }
        }
      ],
      "date_detection": false,
      "properties": {
        "@timestamp": {
          "type": "date",
          "ignore_malformed": false
        },
        "container": {
          "properties": {
            "id": {
              "type": "keyword",
              "ignore_above": 1024
            }
          }
        },
        "data_stream": {
          "properties": {
            "dataset": {
              "type": "constant_keyword",
              "value": "debug"
            },
            "namespace": {
              "type": "constant_keyword",
              "value": "test"
            },
            "type": {
              "type": "constant_keyword",
              "value": "logs"
            }
          }
        },
        "event": {
          "properties": {
            "dataset": {
              "type": "keyword",
              "ignore_above": 1024
            }
          }
        },
        "host": {
          "properties": {
            "hostname": {
              "type": "keyword",
              "ignore_above": 1024
            },
            "name": {
              "type": "keyword",
              "fields": {
                "text": {
                  "type": "match_only_text"
                }
              }
            }
          }
        },
        "message": {
          "type": "match_only_text"
        },
        "service": {
          "properties": {
            "name": {
              "type": "keyword",
              "fields": {
                "text": {
                  "type": "match_only_text"
                }
              }
            }
          }
        }
      }
    },
    "settings": {
      "index": {
        "mapping": {
          "total_fields": {
            "ignore_dynamic_beyond_limit": "true"
          },
          "ignore_malformed": "true"
        },
        "hidden": "true",
        "provided_name": ".ds-logs-debug-test-2024.10.11-000001",
        "creation_date": "1728628274014",
        "number_of_replicas": "1",
        "uuid": "ApyItpxBQPSTnqwXWok9Dg",
        "version": {
          "created": "8512000"
        },
        "lifecycle": {
          "name": "logs"
        },
        "mode": "standard",
        "codec": "best_compression",
        "routing": {
          "allocation": {
            "include": {
              "_tier_preference": "data_hot"
            }
          }
        },
        "number_of_shards": "1",
        "default_pipeline": "logs@default-pipeline"
      }
    },
    "data_stream": "logs-debug-test"
  }
}

UPDATE:
Firing in 4 exact the same messages (timestamp is taken at ingestion) extra, gives bars but counter is still incorrect (5 messages now).

@chouben

Those charts are rates... I do not think just putting a couple of logs is going to work...

I just loaded logs with Python with the same basic data and it works as expected

DATA_STREAM_TYPE = "logs"
DATA_STREAM_DATASET = "debug"
DATA_STREAM_NAMESPACE= "test"
SERVICE_NAME= "pii-generator"

with open(LOG_FILE, "r") as f:
  for line in f:
    
    # Assuming each line represents a single document
    # subtract random time to spread out the logs
    d = timedelta(seconds=(random.randint(0,300)))
    timestamp = (now-d).isoformat()
    document = {
        "@timestamp" : timestamp,
        "message" : line.strip(),
        "service" : {"name": SERVICE_NAME},
        "data_stream": {"dataset" : DATA_STREAM_DATASET, "namespace" : DATA_STREAM_NAMESPACE},
        "run.id" : run_id,
        "file.name" : LOG_FILE,
        "event" : {
         "dataset" : "mycustomlogs"},
        }
    action = {
      "_index": data_stream,
      "_op_type": "create",
      "_source": document
      }
    data.append(action)
    count = count + 1
...

And it loaded and worked fine...

Hi Stephen

Thanks for your test!!

What I understand from above testcase: You have 15 buckets of 1 minutes, where the average is 667. That means you loaded ~10.000 logs (that seems to match visually with your screenshot).

Visualizing the same for my latest test (10 buckets of 1 minute with 5 documents):


Log rate would be 0.5 but is rounded to 1, cfr. below test.

Extra test to decide on required fields (thrice same fields for all documents, but a different timestamp):


3 documents / 3 buckets = 1 log rate
buckets = minute 5, 6, 7

3 documents / 2 buckets = 2 log rate (1.5 rounded to 2)
buckets = minute 6, 7

@stephenb Would you be able to confirm that:

  • At least 2 buckets are required for visualization to work correctly
  • Number on top is the average over all buckets, rounded to a whole number
  • Based on Logs app fields | Elastic Observability [8.14] | Elastic there are a lot of required fields. But it seems only "@timestamp" & "event.dataset" are required, although documentation indicates multiple other fields as required. Correct?

Thanks!
Christof

Hi @chouben The goals of this UI is to show overall Rate Trends ...
So, I am not really sure what you are trying to figure out.
I can say this UI is used widely as Top Level Metrics by 1000s of users, and in general, we believe it to be accurate.

In general, the expectation is that you are ingestings ECS style logs if you want to use the curated UIs. And this UI is

If event.dataset is not set, this screen (should still work or at least it does in 8.15.2) you will get unknown those unknown

Hi @stephenb

I'm not trying to indicate that this view does not work. I did use it as well on my last project. Now I'm trying to enable it as well on my new project, but it is acting strange.

As you have read in my second comment, I did send in +20.000 logs (migration of old elasticsearch). But the overview is not showing them. So first target is to understand this view, to be able to understand what is wrong with my jboss-fat index.

The overview in below screenshot (8.14.3) contains 60 minutes (= 60 buckets), so that means that system.auth consists of only 2400 logs. It does not make sense that my logs for jboss-fat are not shown (+20.000 logs).

Do you see any reason why they are not shown?

Thanks
Christof

event.dataset: jboss-fat
7162 documents:

Distrubution over the full day: 1,350,276

event.dataset: system.auth
2145 documents:

Distrubution over the full day: 51,391

Log rate per minute
Same timeframe: 00:00-01:00

And the "Logs rate per minute" view uses the same dataview as above "discover":

No, I don't know why... Yes, I would expect them to show assuming everything is configured correctly and ingested correctly>

When you say migrate what does that mean?

If you go to discover, are they shown correctly there? Do you see the right number? I can't really tell ...

Do you have a timestamp or time zone issue? Are these logs in the past or the future?

Is the @timestamp correct? Is the event.ingested timestamp correct

There's something subtle going on I suspect.

Perhaps there's a minor bug between 8.14.3 and 8:15.2, which is what I'm using But I I'm not aware ofI'm not aware of anything related to that

Checking

What is the data stream name? And what is the dataset name? And what is the event.dataset values

Are they all consistent?

Take the - out of the event.dataset and cannot be part of data_stream.dataset

Try jboss.fat for both

Hi @stephenb

Sorry for the dealy, I didn't find time to do the requested test yesterday.

Test
I did the migration again for the specific datastream (Logstash pipeline below - Fetch data from elasticsearch 7.16 and load it in 8.14.3):

Same result:

event.dataset does now contain a . instead of a -. Below a sample document:
PS: a colleague of you used - in this sample "Unknown" logs in observability overview - #2 by felixbarny. That's where I got it from.

All below fields are on the screenshot above as before (if you prefer it in a different format because of readability, please do request):

    "data_stream": {
      "namespace": "jboss",
      "type": "logs",
      "dataset": "info"
    },
...
    "event.dataset": "jboss.fat"

I don't think we are facing timezone issues:

{
  "_index": ".ds-logs-info-jboss-2024.10.16-000001",
  "_id": "GbtLlJIBP4HuDLbvLht9",
  "_version": 1,
  "_score": 0,
  "_source": {
...
    "@timestamp": "2024-09-28T22:00:05.852Z",

To avoid timezone issues I also started loading bigger chunks of consecutive days that even if there would be shifts in hours, there would still be enough data available (as you see below) - 28/9 to 1/10 and we are looking at 29/9:

Migration pipeline

Logstash file 1:

#Only pipeline size 500 & scroll 5m
#Other running pipeline size 200 & scroll 5m
input {
 elasticsearch {
    hosts => "localhost:9200"
    index => "jboss-fat-2024.09*"
    query => '{  }'
    size => 200
    scroll => "5m"
    docinfo => true
  }
}

filter {
#Parse data via new logic (remove deducted fields)
      mutate {
        remove_field => [ "loglevel", "thread", "logtime", "class", "logmessage", "context" ]
      }


#ID is generated below, old tags are removed first
      mutate {
        remove_tag => [ "idParsed", "idParsingFailed", "dateparsed", "idParsed" ]
      }

#key is required for bug: https://github.com/logstash-plugins/logstash-filter-fingerprint/issues/46
    fingerprint {
      source => "message"
      target => "[@metadata][fingerprint]"
      method => "MD5"
      key => "XXX"
    }
    ruby {
      code => "event.set('[@metadata][tsEpochMilliPrefix]', (1000*event.get('@timestamp').to_f).round(0))" 
    }

    if [@metadata][tsEpochMilliPrefix] and [@metadata][fingerprint] {
        mutate {
#Document ID is set in the elasticsearch output plugin
#            add_field => { document_id => "%{[@metadata][tsEpochMilliPrefix]}%{[@metadata][fingerprint]}"}
            add_tag => [ "idParsed" ]
        }
    } else {
        mutate {
            add_tag => [ "idParsingFailed" ]
        }
    }
}


output {
	if [fields][type] == "jboss" {
	  pipeline { send_to => "jboss-input" }
	} else if [fields][type] == "cassandra" {
	  pipeline { send_to => "cassandra-input" }
	} else if [fields][type] == "kpi" {
	  pipeline { send_to => kpi }
	} else if [fields][type] == "monitoring" {
	  pipeline { send_to => monitoring }
	}
}

Logstash file 2:

input { pipeline { address => "jboss-input" } }

filter {
       grok {
          patterns_dir => ["/etc/logstash/patterns"]
          match => [ "message", "^%{TIMESTAMP_ISO8601:[log][time]}%{SPACE}%{SLOGLEVEL:[log][level]}%{SPACE}\[%{ENDCONTEXT:[log][context]}\]%{SPACE}\(%{NOTBRACKET:[log][thread]}\)%{SPACE}%{GREEDYDATA:[log][content]}$"] 
        }
        mutate {
            convert => [ "pid", "integer"]
            remove_field => ["offset", "[prospector][type]"]
        }
        date {
            match => [ "[log][time]" , "yyyy-MM-dd HH:mm:ss,SSS" ]
            timezone => "Europe/Brussels"
            add_tag => [ "dateparsed" ]
        }
	#https://www.elastic.co/guide/en/observability/current/logs-app-fields.html
	#https://discuss.elastic.co/t/log-source-unknown-in-observability-overview/262568
	#Required to have the source in Observability - Logs view
      mutate {
        add_field => { "event.dataset" => "%{[fields][type]}.%{[fields][env]}" }
		add_field => { "service.name" => "jboss" }
		add_field => { "host.hostname" => "%{[host][name]}" }
		add_field => { "container.id" => "jboss-%{[host][name]}" }
		add_field => { "log.file.path" => "%{[source]}" }
		#rename => { "[host][name]" => "[host][hostname]" }
      }			  
}

I hope I answered all requests.. :smiling_face:

Best regards
Christof

PS:

I assume you do advise now to upgrade to the latest version. I'm still in development phase, so that would be perfectly feasible.

Not Really sure what to tell you at this point.

Perhaps upgrade to 8.15.2

I can't debug your logstash...

Compare Discover use breakdown event.dataset by 1 minute interval

Then Observability Overview for 30 Mins

They Looks the same for me, if they don't for you I am not sure what to tell you..

I would load some data from another method...
Then do the comparison if that works then I would look at your migration logstash pipelines.