I have an index which has the following fields
duration: 500 (in ms)
timestamp: (in epoch)
I want to plot the 95 percentile, 75 percentile, 50 percentile over time. Something similar to the below graph

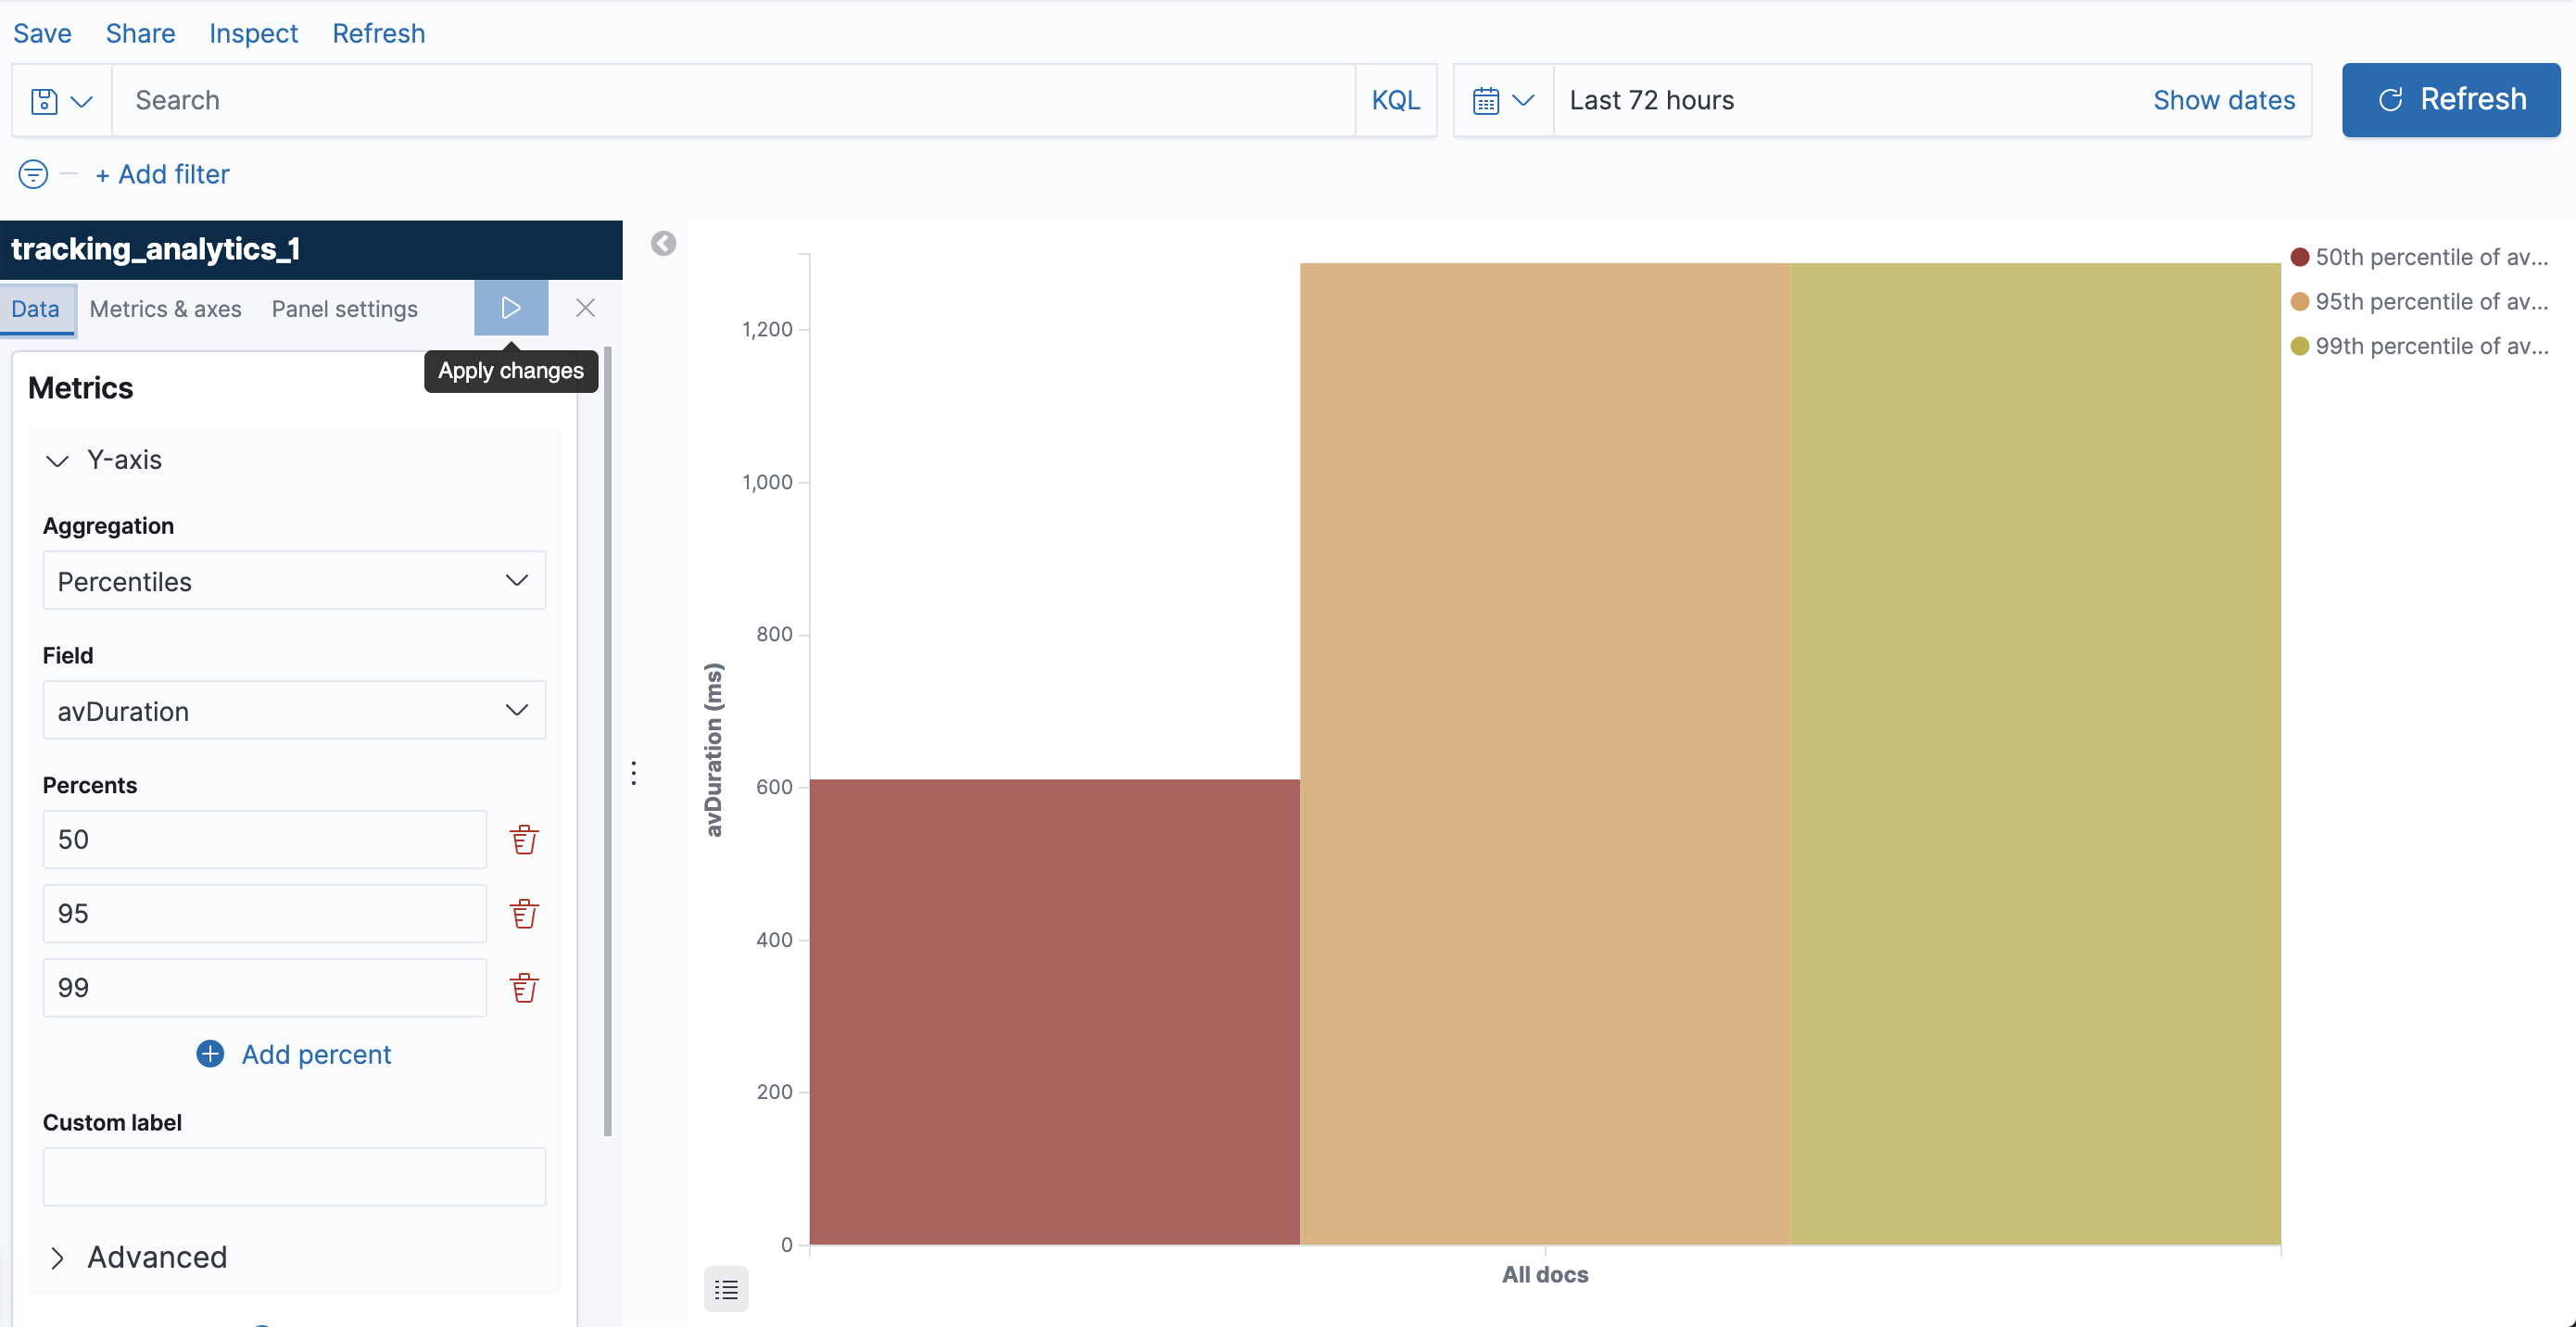
Right now I was able to plot the percentiles, but not able to plot it over time. Pasting what I have currently done.