Hi,
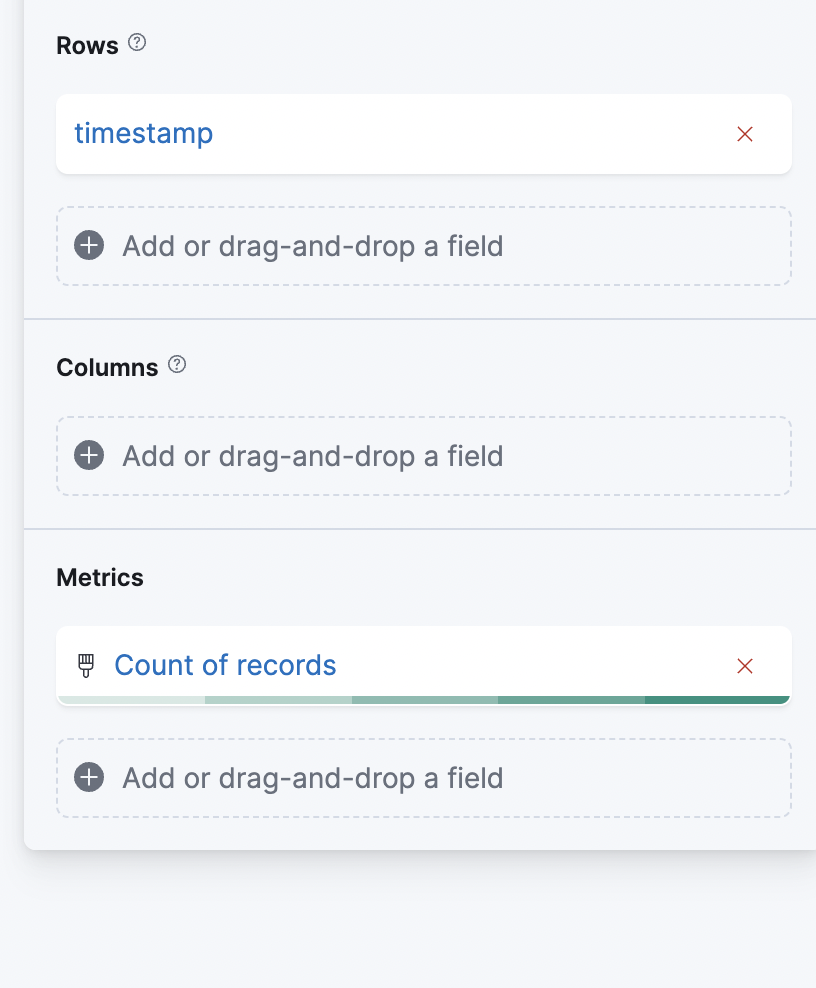
I want to plot a table with custom rule based color for each cell. so, for below table, if debt is more than income, it should be red. if income is more than debt, it should be green. is this possible? how?

Hi,
I want to plot a table with custom rule based color for each cell. so, for below table, if debt is more than income, it should be red. if income is more than debt, it should be green. is this possible? how?
Hi @Tukaram, I don't think that the solution you're aiming for is possible, but you could achieve similar effect using runtime field. You could create a custom runtime field that calculates the difference between the two:
Let me know if this is helpful.
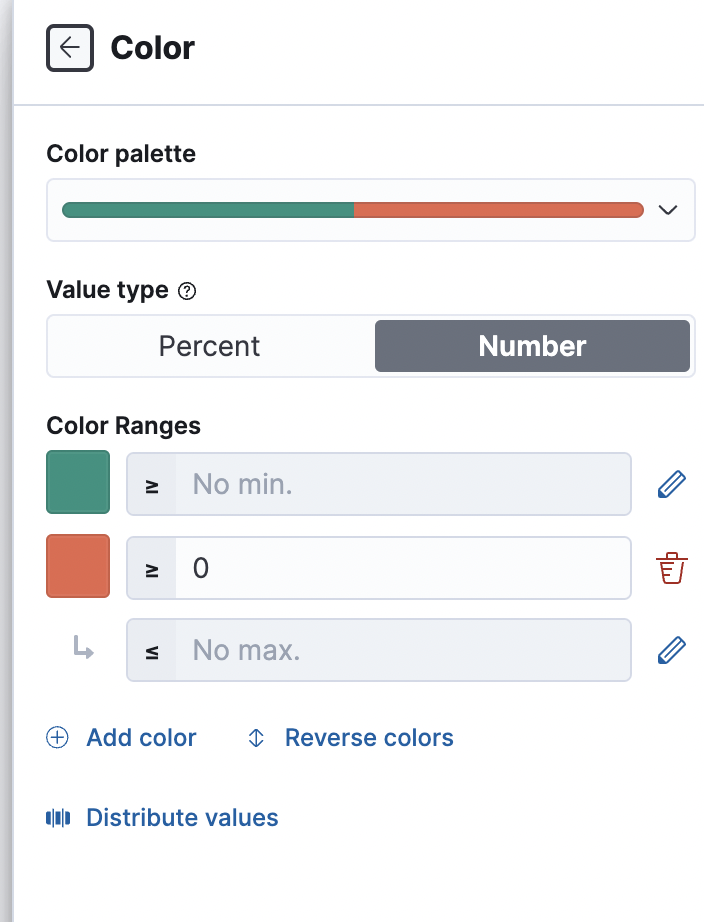
Thanks, how you are setting custom color here? I can push diff as separate field as well.
I mean, are these colors rule based? for positive, its green and negative its red?
I am using 7.16.2 and dont see any option for 'color by Value' or color after text alignment.
That's strange, the feature was released in 7.14. Are you sure you're clicking on the right dimension? Could you paste a screenshot of what you see?

this is what all I got.
Well, interesting, I could not find that option on existing fields but tried adding new and its there. Great! will give it try.
© 2020. All Rights Reserved - Elasticsearch
Apache, Apache Lucene, Apache Hadoop, Hadoop, HDFS and the yellow elephant logo are trademarks of the Apache Software Foundation in the United States and/or other countries.