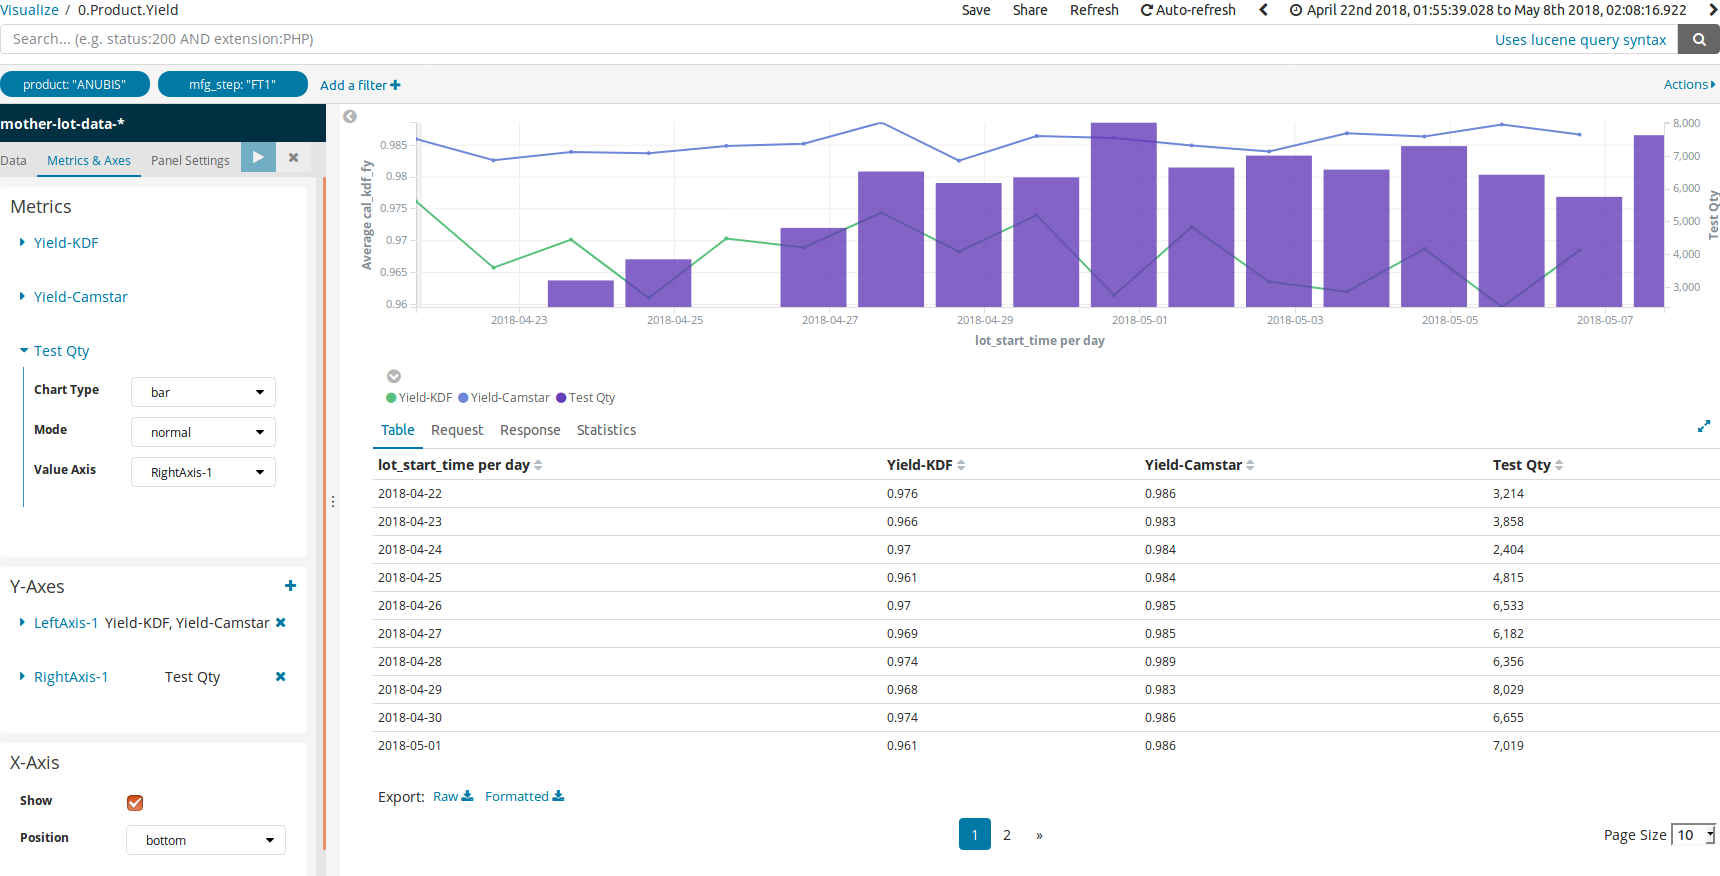
while changing Metrics Test Qty type to 'bar'
the bar char adds 2 dummy point before the date point.
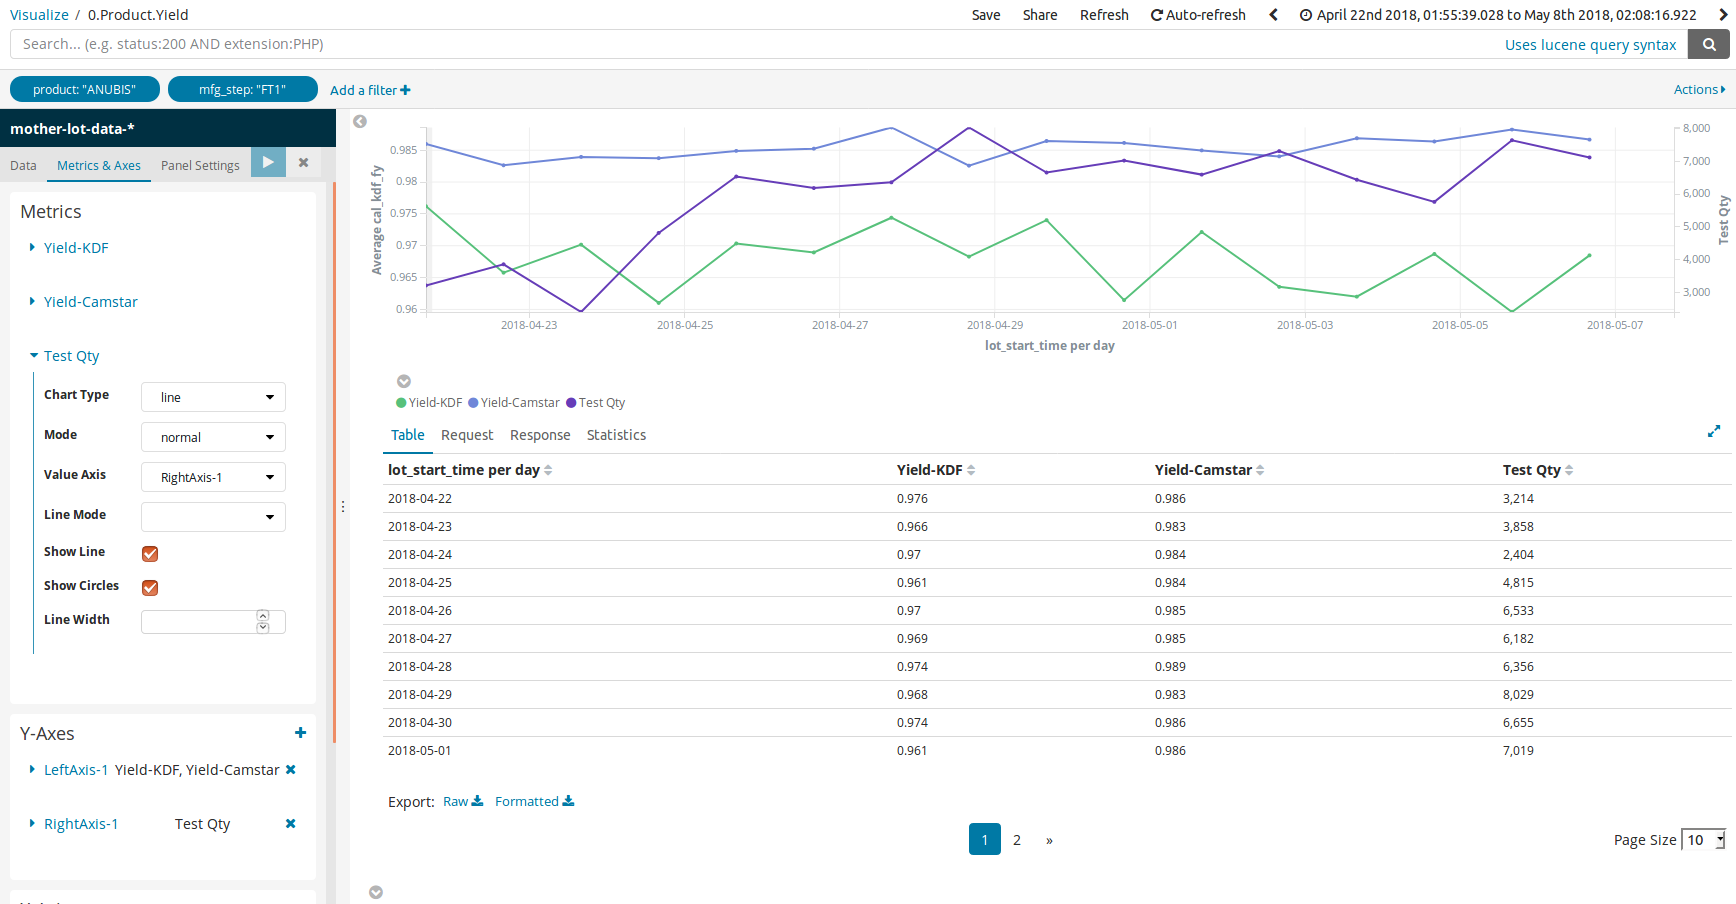
while changing the type to 'line', all the metrics point are aligned
I got the workaround that is, set the 'bar' Chart Type Metric as the first one, then all the chart series will aligned with the first one. but this only can align the head but the bar char tail sometimes still missed.
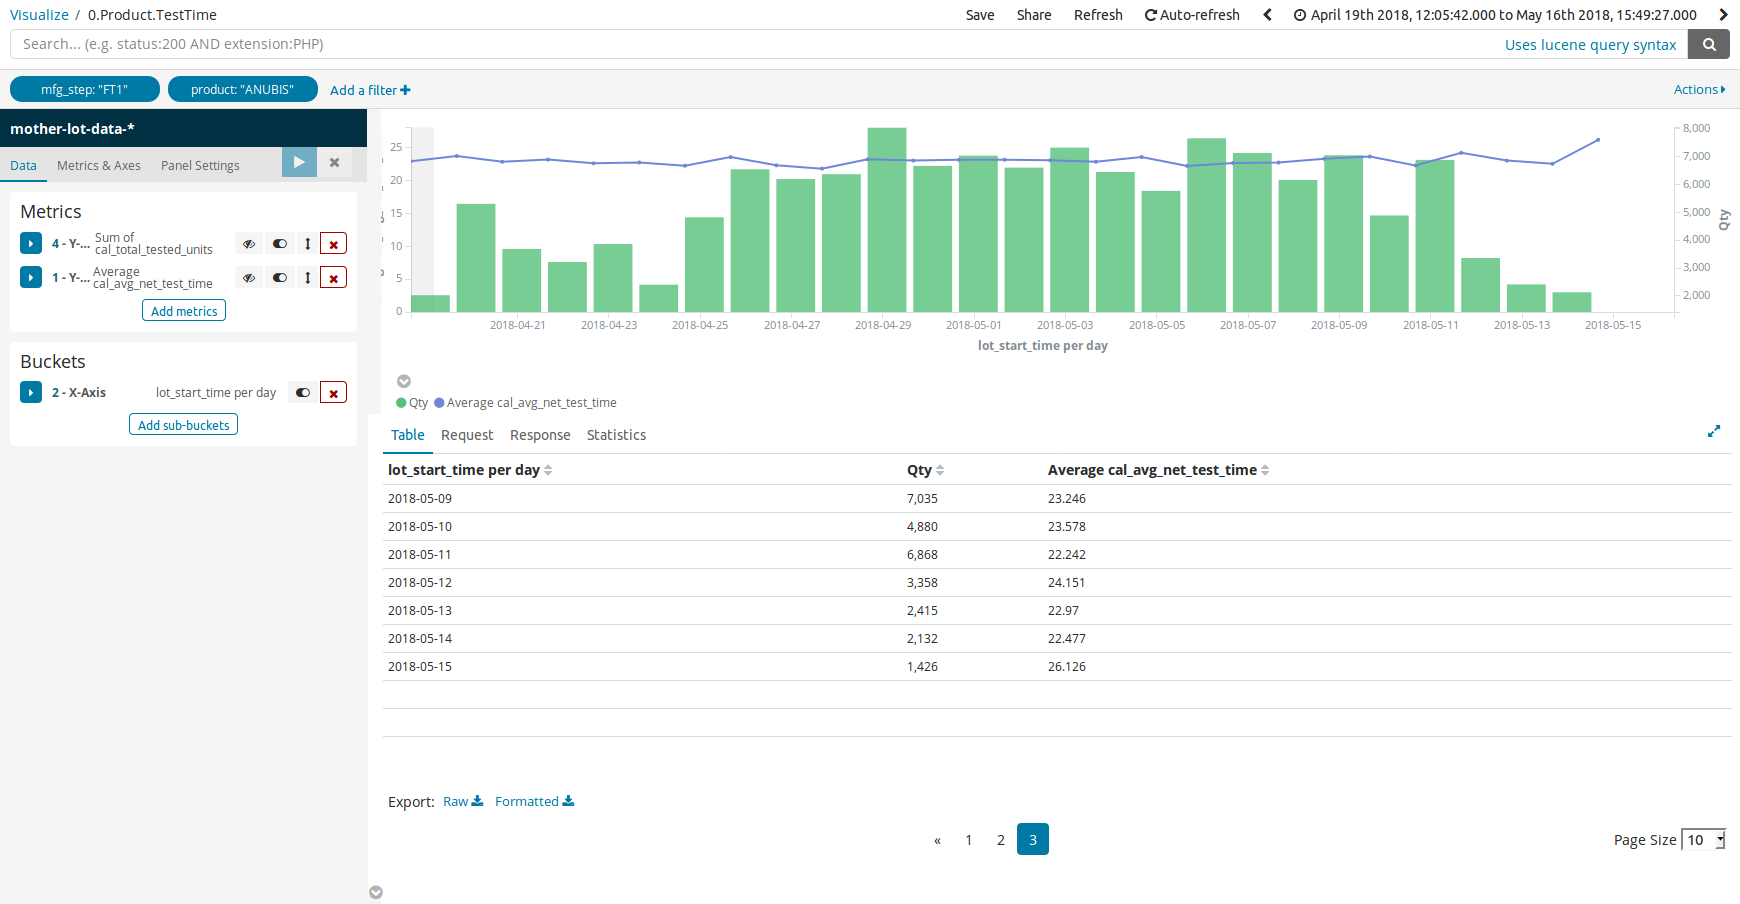
the last date point is missed sometimes in the dashboard.
the last one bar char is missed
Hey @guanghaofan, which version of Kibana are you running? Also, can you export the problematic Visualization and attach it here?
My Kibana is 6.2.5-snapshot version
In this char, the last date point is missed in the bar: 2018-05-15, Qty 1426
here is the screen shot
the request:
{
  "size": 0,
  "_source": {
    "excludes": []
  },
  "aggs": {
    "2": {
      "date_histogram": {
        "field": "lot_start_time",
        "interval": "1d",
        "time_zone": "Asia/Shanghai",
        "min_doc_count": 1
      },
      "aggs": {
        "1": {
          "avg": {
            "field": "cal_avg_net_test_time"
          }
        },
        "4": {
          "sum": {
            "field": "cal_total_tested_units"
          }
        }
      }
    }
  },
  "stored_fields": [
    "*"
  ],
  "script_fields": {},
  "docvalue_fields": [
    "@timestamp",
    "date",
    "lot_end_time",
    "lot_start_time",
    "system_date",
    "system_time",
    "updated_time"
  ],
  "query": {
    "bool": {
      "must": [
        {
          "match_all": {}
        },
        {
          "match_phrase": {
            "mfg_step": {
              "query": "FT1"
            }
          }
        },
        {
          "match_phrase": {
            "product": {
              "query": "ANUBIS"
            }
          }
        },
        {
          "range": {
            "lot_start_time": {
              "gte": 1524110742000,
              "lte": 1526456967000,
              "format": "epoch_millis"
            }
          }
        }
      ],
      "filter": [],
      "should": [],
      "must_not": []
    }
  }
}And the converted table since the response is beyond the limit:
"lot_start_time per day",Qty,"Average cal_avg_net_test_time"
1524067200000,2027,"22.883224487304688"
1524153600000,5296,"23.65998020172119"
1524240000000,3681,"22.779942648751394"
1524326400000,3214,"23.12090015411377"
1524412800000,3858,"22.558071408952987"
1524499200000,2404,"22.687775135040283"
1524585600000,4815,"22.196462631225586"
1524672000000,6533,"23.50210018157959"
1524758400000,6182,"22.249309921264647"
1524844800000,6356,"21.75174026489258"
1524931200000,8029,"23.158120091756185"
1525017600000,6655,"22.96839244549091"
1525104000000,7019,"23.082909150557086"
1525190400000,6592,"23.098969239455002"
1525276800000,7307,"23.012973403930665"
1525363200000,6435,"22.794875144958496"
1525449600000,5761,"23.521509170532227"
1525536000000,7640,"22.157335826328822"
1525622400000,7115,"22.613776793846718"
1525708800000,6148,"22.67639992453835"
1525795200000,7035,"23.246050039927166"
1525881600000,4880,"23.57756699456109"
1525968000000,6868,"22.24150900407271"
1526054400000,3358,"24.151299794514973"
1526140800000,2415,"22.969619750976562"
1526227200000,2132,"22.477224826812744"
1526313600000,1426,"26.125600814819336"
Hey @guanghaofan, which version of Kibana are you running? Also, can you export the problematic Visualization and attach it here?
I think this also happens on version 6.3.0, this is a example that version:
here you can see the leading and the tail are not aligned across the bar chart and the line chart
Hey @guanghaofan these seem like two separate bugs, would you mind creating two separate issues for these here
2 issues created:
© 2020. All Rights Reserved - Elasticsearch
Apache, Apache Lucene, Apache Hadoop, Hadoop, HDFS and the yellow elephant logo are trademarks of the Apache Software Foundation in the United States and/or other countries.