So how to use other graph (bar chart). I dont see a way to change the view from dashboard itself. I need to edit visualization chnage this to bar chart and then save it as below
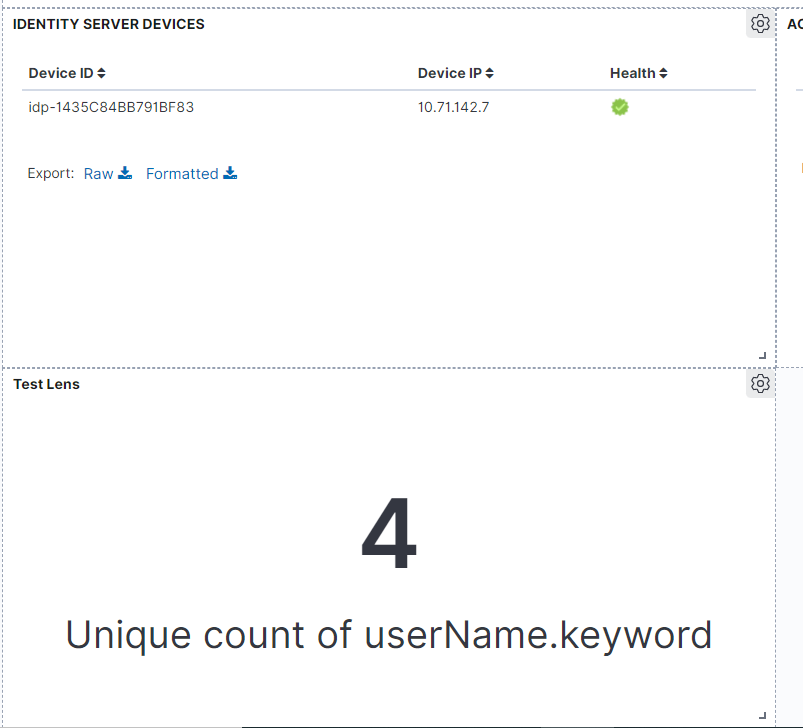
In your first screenshot I can see one chart (metric one) with 2 suggestions: do you want to show all the visualizations in the suggestion list on your dashboard?
If that is the case, there's a simple thing you can do:
Clone the metric Lens visualization (in Edit mode click the cog icon on the top right of the panel, then "Clone")
Open the cloned visualization in Lens (still cog icon => Open in Lens)
click on the suggested chart on the suggestion list (the bar chart one)
Correct.
With the cloning step you can speed up a bit the data configuration, but then a minimum editing for the final tweak (chart type or else) is required.
Apache, Apache Lucene, Apache Hadoop, Hadoop, HDFS and the yellow elephant
logo are trademarks of the
Apache Software Foundation
in the United States and/or other countries.