I've set up ELK and feeding it some logs via TopBeat.
I can see the data in Discover, (filter set to type:system) I get green bars at the top, 1 every 5 seconds, can see values per item in the table columns...
So,... save search and move to the Visualize tab...
When I change the metrics to X date Histogram @timestamp over Y AVG cpu.system_p nothing is shown in the visualisation.
The only agg that works is count....can zoom in to 1 per five seconds...
If you D oget a visualization for "count" metric , then your timestamps are obviously working and available for the specific time period... so I cant imagine why a "AVG" metric wont work other than the cpu.system_p values being empty.
But then again you said you Can see values for system_p on the discover tab ?
Maybe you can post a screenshot of your discover tab , with the system_p added to the display columns as well as your visualization configuration.
What is the mapping for the field? When I have seen this behaviour in the past it has quite often been due to fields being incorrectly mapped as strings instead of integers and/or floats.
My first thought as well , but the metric configuration wont let you choose string type fields - so I'm assuming its mapped as a numeric type.
And I believe a number type is a number - theres no strict integer casting that would round an average down to 0 (unless configured in the Kibana field formatter) ?
I'm sorry , I cant see any reason it should not be plotting.
Out of curiosity .. does average on for instance mem.used_p work ?
Or how about sum of cpu.system_p ?
I'll see if I can get some topbeat going at some point to simulate the situation.
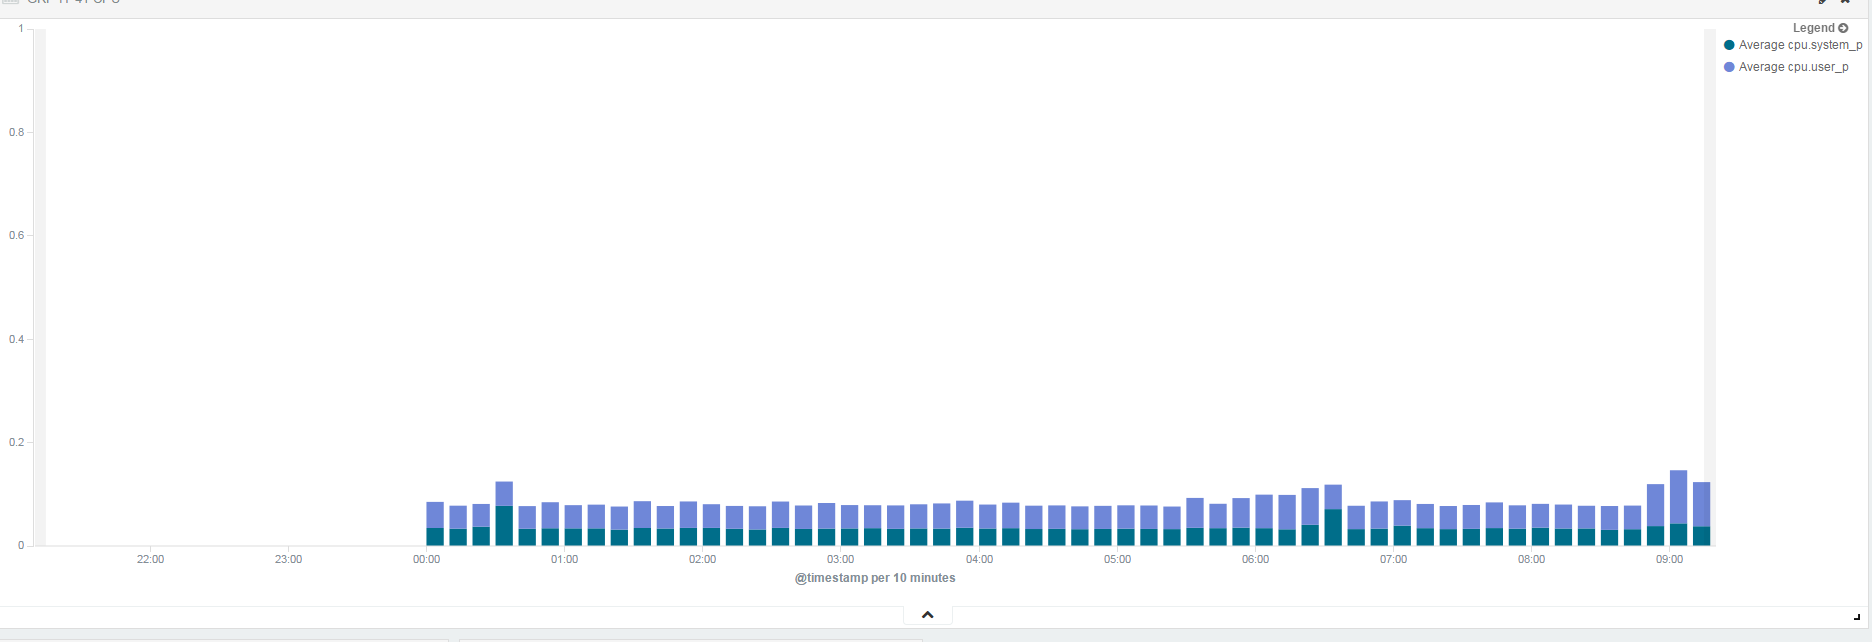
...hmmm just got to work to double check your questions, added the Vis for avg CPU.system_p and user_p ( bar chart) ....and noticed values....strange...widened the time span to last 12hrs. I get AGGs from midnight only!
Two things I changed, 1, TopBeat is now installed as a service on the monitored machine, since about 10am yesterday, if that was the fix then then why from midnight? Is there some daily 'bucket' of data and the prior days bucket has bad data?
Logstash is running as Linux service...I was running it from the terminal before as I had it sending to STDOUT whilst I was trying to learn what was going on...but I'm wondering, if i had two copies of Logstash running, one as a service and one at the Terminal....
Aw man - I should have picked that up , since I had almost exactly the same problem - but the other way around (one was double and the other long) which resulted averages in the trillions ... and I feel doubly bad as I previously stated that there is no strict integer vs double types. I was confusing myself with the types Kibana maps to the ES types.
I would definitely say the "double" would do the trick and is almost certainly why you Are seeing averages for today.
What is strange is that you Did still see percentage values for yesterday when it was mapped as long.
Maybe I should just keep quiet before I put my foot in my mouth again.
Apache, Apache Lucene, Apache Hadoop, Hadoop, HDFS and the yellow elephant
logo are trademarks of the
Apache Software Foundation
in the United States and/or other countries.

 bad as I previously stated that there is no strict integer vs double types. I was confusing myself with the types Kibana maps to the ES types.