Hello,
I have succesfully created a TSVB visualization that shows the ratio of orders/searches per customer number as my image and detailed info show below.

denominator = event_type.keyword : "fulltextsearch" and "fahrzeugsuche" and "teilesuche"
Nevertheless i want to extract that info as a csv file and that is not possible with TSVB.
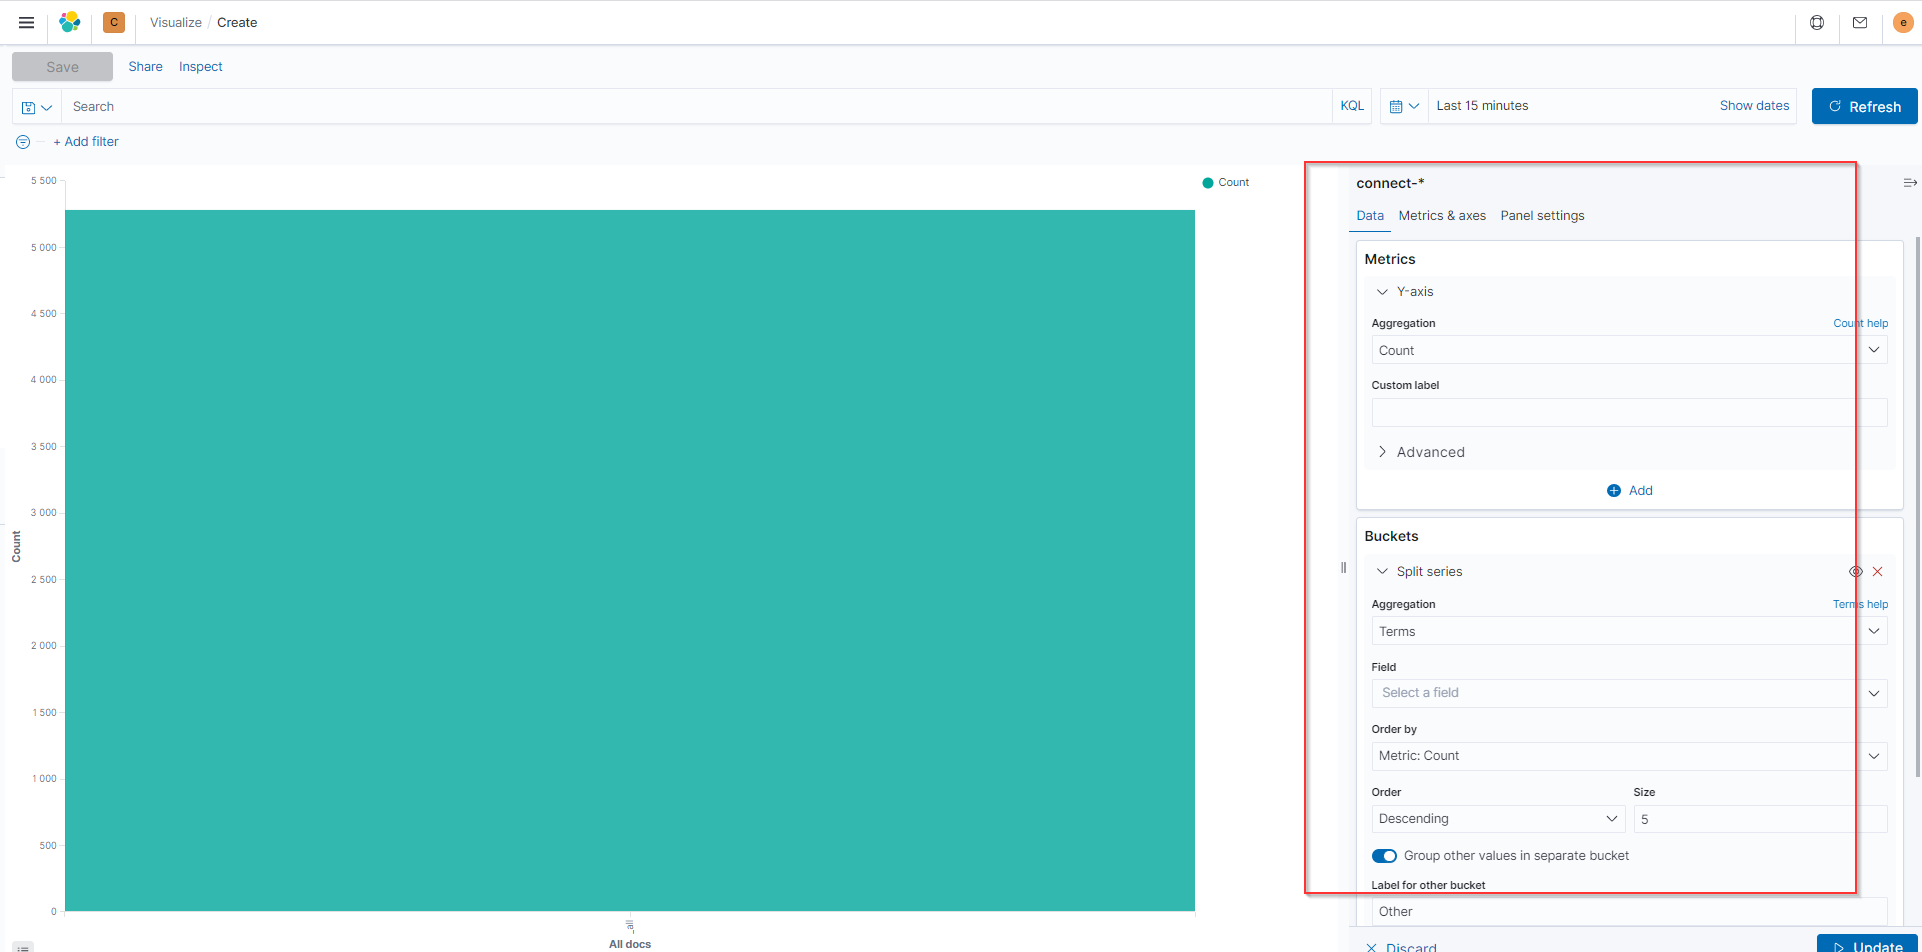
How can i create the exact same info but instead of using a TSVB to use a data table visualization as it is shown below so that i can export it as a csv file at the end?
Thank you