ruif0
September 18, 2021, 6:28am
1
My data look like this:
{
	"type":"Error",
	"server":["Country1/State1/City1",null]
}

{
	"type":"Error",
	"server":["Country1/State2/City2",null]
}

{
	"type":"Error",
	"server":["Country2/State3/City3",null]
}
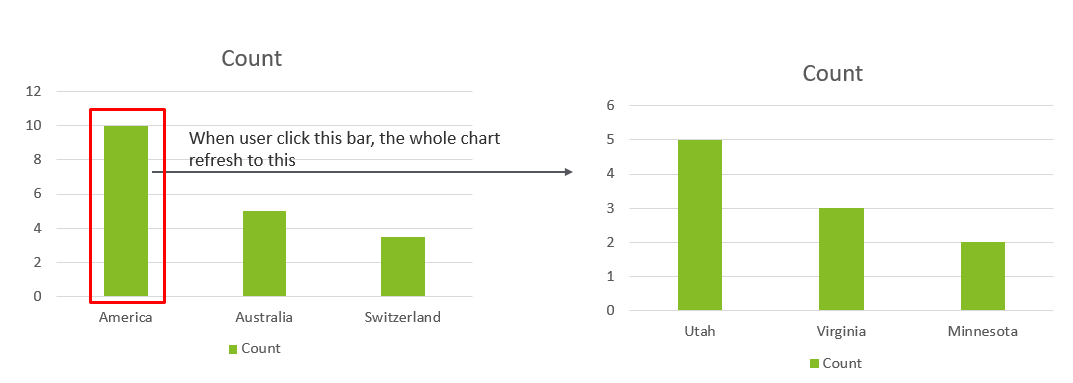
I want to create a bar chart which count by country first, when user click one of the country bar, the chart refresh and show the count by state.
Can I do this with Kibana?
tmp13
September 19, 2021, 7:30pm
2
Hi."when user click one of the country bar, the chart refresh and show the count by state" I think that is impossible, but you can try drilldown:
Make dashboards interactive | Kibana Guide [8.11] | Elastic
You can create two dashboards:
First contains "All Country" like this
Second contains "All State" like this:
(You can add more dashboards: city, street etc...)
On first (All Country) you can add drilldown (see first screen), by click on that you will go to second dashboard with filter by country:
And on dashboard "All State" you will see:
But I don`t understand your data... I created simple index like this:GET cstate/_source/1
etc...
ruif0
September 22, 2021, 1:06am
3
Thanks! But my client want to do this with one chart.
warkolm
September 22, 2021, 4:58am
4
The drilldown approach above is currently the only way to do this in Kibana.
tmp13
September 22, 2021, 7:18am
5
Create two maximum similar dashboards and