Hello
Recently I tried to do a term search but I want the y-axis to count all the term frequencies in the whole index is this possible ? because I can't modify the x-axis
Kind regards
T
Hello
Recently I tried to do a term search but I want the y-axis to count all the term frequencies in the whole index is this possible ? because I can't modify the x-axis
Kind regards
T
Are you saying you want the chart to ignore the date range set in the top right hand corner, and aggregate on the entire index instead? If so, that's not possible. If not, you might need to elaborate on the issue further.
Hi there!
So, is it possible to plot in X-axis the date/time and in Y-axis the occurrence of a field ie between 7:00-8:00 field1 appears 6 times at 8:00-9:00 appears 4 times etc ?
Also, I am interested in modifying the Y-axis like calculating a division of 2 fields over time. For example, I want to calculate something like this <counter of field1 until time X>/<counter of field2 until time X> and plot the result for each time X.
Is there a way to do that like with scripted fields or JSON input? Any ideas would be so helpful.
I don't know if these questions are relevant to the topic but I want to find a way to enrich my dashboard with more specific and valuable graphs without just choosing between Count, Max, Min, Average etc in Y-axis.
Thank you in advance.
What do you mean by "occurrence of a field ie between 7:00-8:00"? Does the field not appear in all documents, and you want a count of all documents that have that field? Or are you looking for a count of all unique values for that field in that time period? Or something else?
The second example is probably not possible currently. If support were added for them, scripted metric aggregations might allow you to do this: https://github.com/elastic/kibana/issues/2646
You might also want to check out Timelion, a Kibana plugin that might be able to answer similar questions to the ones you're asking.
Thank you for your answer. I took a look of what you said.
What I meant in my first question (sorry it wasn't clear) was how to plot a counter or the frequency of a numeric value of a field over time. For example when you plot a counter you should see a continuously increasing value with different gradient of the line over time.
With timelion I couldn't do that because when it extracts from elasticsearch it counts a field or the frequency of a value of a field per a specific interval eg 1m. Also, I think you can't plot the values of a field.
My use case, ideally, is to plot the counter of the top 5 src or dst IPs over time, so 5 continuously increasing lines. If the top 5 thing makes it more difficult, it would be ok if I can plot just the counter of one src or dst IP. In addition, I want to plot the change of the size of a packet over time, so to plot the value of the field packet_size.
So, have I been left with just the option of the scripted fields and JSON input? Any other input it would be really appreciated or even where should I address my problem.
Thanks again.
Plotting the frequency of a single ip should be as simple as doing a date histogram with a count metric and a filter for the ip value you want to see.
In terms of tracking a top 5, how would you determine the top 5? Do you basically want to get a top 5 ip list for a given time period (say, 24 hours) and then visualize the count for those top 5 per hour, within that 24 hour period? It might help if you tell me what the root question is that you're trying to answer about your data.
For packet_size, if an average or other aggregated value is ok, you should be able to achieve that in Kibana with a date histogram and whatever metric is most appropriate. If you want to see the individual values graphed, that's something you'd use Timelion for.
I think I am getting maybe what my problem is. I am in testing and I index data with let's say 300 index rate for 20 mins. So I care about to see some expected results just in this time frame at the moment before I move on.
Concerning the frequency thing, I have tried this but I have the same problem with Timelion. The counter of this specific IP does not continuously increasing. There is a time interval (1s or 1m or 1h etc) in which the counter counts the frequency of the value and it counts from zero for every interval. As a result I can't use this graph. Even if I "zoom out" and the interval is 1h, for example, the accuracy of the graph is not so good because there is just a straight line and I can't see any steep increase.
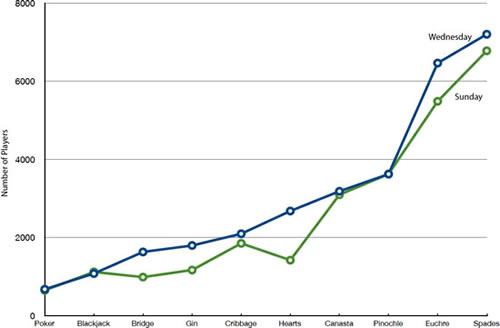
So, at the moment, for a given time period (20mins) I want to visualize the change of the count over time for the top 5 IPs or for just an IP I define for the whole given time period; without any intervals, just plotting a dot at the time I see a specific IP in a given time period in ES. Generally, I expect the lines of the graph to be something like this.
My use case is this:
I have 2 fields srcIP and dstIP and I want to be able to show a line chart with X-axis the time and Y-axis the <counter of dstIP over time>/<counter of srcIP over time> (or if you prefer <received counter>/<sent counter>), where dstIP = srcIP for the top 5 ratios or for a specific srcIP. If the ratio is above a threshold maybe someone is attacking you. As an alternative, if I can't divide or subtract things etc I want at least to show these 2 counters of an IP over time.
I hope I provided enough information of what I want to do. I am just not sure if I care for such small changes that Kibana doesn't. All in all, I want to use Kibana as a very simple excel file.
Thanks for keeping up with me!
Ok, I think I understand what you mean. Let me rephrase the simple use case to see if I get it.
You want a line graph with a dot for every document that contains a specific ip. The placement of each dot on the y-axis is based on the total count of that ip, up to the time that that specific dot occurred. So the graph essentially shows the increasing TOTAL count of a single ip over a given time, with dots for each individual occurrence.
Is that correct? If so, that's something Kibana can't really do at the moment. Kibana always deals with aggregations, not individual events, so you won't be able to plot a dot per document. Also, as far as I know, there's no way to create a total count over time.
May I ask why a total count helps you but a count per some interval doesn't? If you're looking for a change in the rate of requests for a single ip, either of these graphs should show a spike. A flat line on the interval graph will still be a straight line on the total count graph, so I'm not sure what you'd see on the total count that you wouldn't see in the interval graph.
Yes, I wanted exactly this! I think the key word I had to mention was "total" count, as you noted.
Now, the reason I want this line graph with the total count is because most people are used to this, they can understand it and come to conclusions more easily. Also, when you have intervals the graph is more "messy" with spikes and stuff which don't make obvious the change of the value over time and doesn't help to just take a look of it and come to a conclusion. Finally, as I told you even if you "zoom out" and put a bigger interval you "lose" some data and therefore some accuracy.
Most people coming from excel or something like this or people who want to do some simple analytics, when they use a tool like Kibana and Elasticsearch they expect to do, at least, the same simple analytics they are already familiar with.
So, in order to have a complete solution here, as you have already said, if I want to plot the frequency of a single IP I should put a date histogram in X-axis with a count metric and a filter for an IP value. Is there a way to filter this automatically for the top 5 dstIPs of a given time and also show the srcIPs of the same value ( dstIP = srcIP). If this is not possible, I am interested even in typing manually the srcIP when I know which the most popular dstIPs are (of course I don't want to aggregate dstIPs, to find the top 5 IPs and then make another visualization, as I am doing now).
© 2020. All Rights Reserved - Elasticsearch
Apache, Apache Lucene, Apache Hadoop, Hadoop, HDFS and the yellow elephant logo are trademarks of the Apache Software Foundation in the United States and/or other countries.
