Hi ,
I wants to display RAM(total Ram, Used ram , Free ram) through pie chart in Kibana.
can anybody help me with steps
Thanks & Regards
Shrikant
Sure, this can be achieved through Pie chart visualization.Use the filters aggregation in a split slices bucket. You can probably have a Perhaps you could use the pie chart - "filters" aggregation in a "split slices" bucket. You would probably just have a filter for total RAM, used RAM and Free RAM then the pie chart would show you the distribution.

Can you please let us know how your mappings look like? And also your filter doesn't look right. You may not be able to visualize in a pie chart what you are looking for, but it will depend on your mappings.
Thanks
Rashmi


Mappings don't show the exact relevance . Do u have access to actual RAM value , Used RAM and Free RAM values in ur cluster ? Are they different fields ? You probably won't be able to use a pie chart. But you can put them next to each other on a bar chart .
What should be my mappings.
Yes I was able to show them through bar chart.
Pls guide me through mappings
Thanks & Regards
Shrikant
In the mappings, each level usually defines a properties setting, which maps the keys of the document at that level to its mapping. This structure is hierarchical, which means that every level down to the leaf nodes may include properties settings for its child values. I would suggest you to read through couple of introductory links, which would give you a fair understanding of your mappings .
https://www.elastic.co/guide/en/elasticsearch/reference/current/mapping.html
Glad you got it working through a bar chart visualization.
Thanks
Rashmi


hi @shrikantgulia,
it would be helpful if you could paste your mappings as plain text. Those screenshots are hard to work with from our end.
As for using the pie-chart, those charts are generally used to show the distribution of exclusive categories. So I'm not sure how you would be able to show total RAM, but also used and free ram in a single pie-chart.
You could conceivable show a pie-chart with two slices, one for free ram and another for used ram, but you will need a way to compute both so both categories are part of the same result-set. This would be possible s if you had different documents in your index, one for the used ram, the other for the free ram. Then you can easily filter on each, summing the values for those fields by type.
"system": {
"properties": {
"core": {
"properties": {
"id": {
"type": "long"
},
"idle": {
"properties": {
"pct": {
"type": "float"
}
}
},
"iowait": {
"properties": {
"pct": {
"type": "float"
}
}
},
"irq": {
"properties": {
"pct": {
"type": "float"
}
}
},
"nice": {
"properties": {
"pct": {
"type": "float"
}
}
},
"softirq": {
"properties": {
"pct": {
"type": "float"
}
}
},
mappings after the command (GET (indexname)/_mapping)
Hello Rashmi,
I read about mappings in the tutorial & its my mapping for my metricbeat logs
{
"infinia-restaurant-demo": {
"mappings": {
"doc": {
"properties": {
"@timestamp": {
"type": "date"
},
"beat": {
"properties": {
"hostname": {
"type": "text",
"fields": {
"keyword": {
"type": "keyword",
"ignore_above": 256
}
}
},
"name": {
"type": "text",
"fields": {
"keyword": {
"type": "keyword",
"ignore_above": 256
}
}
},
"version": {
"type": "text",
"fields": {
"keyword": {
"type": "keyword",
"ignore_above": 256
}
}
}
}
},
"metricset": {
"properties": {
"module": {
"type": "text",
"fields": {
"keyword": {
"type": "keyword",
"ignore_above": 256
}
}
},
"name": {
"type": "text",
"fields": {
"keyword": {
"type": "keyword",
"ignore_above": 256
}
}
},
"rtt": {
"type": "long"
}
}
},
"system": {
"properties": {
"cpu": {
"properties": {
"cores": {
"type": "long"
},
"idle": {
"properties": {
"pct": {
"type": "float"
}
}
},
"iowait": {
"properties": {
"pct": {
"type": "float"
}
}
},
"nice": {
"properties": {
"pct": {
"type": "float"
}
}
},
"softirq": {
"properties": {
"pct": {
"type": "float"
}
}
},
"steal": {
"properties": {
"pct": {
"type": "float"
}
}
},
"system": {
"properties": {
"pct": {
"type": "float"
}
}
},
"user": {
"properties": {
"pct": {
"type": "float"
}
}
}
}
},
"fsstat": {
"properties": {
"count": {
"type": "long"
},
"total_files": {
"type": "long"
},
"total_size": {
"properties": {
"free": {
"type": "long"
},
"total": {
"type": "long"
},
"used": {
"type": "long"
}
}
}
}
},
"load": {
"properties": {
"1": {
"type": "float"
},
"5": {
"type": "float"
},
"15": {
"type": "float"
},
"norm": {
"properties": {
"1": {
"type": "float"
},
"5": {
"type": "float"
},
"15": {
"type": "float"
}
}
}
}
},
"memory": {
"properties": {
"actual": {
"properties": {
"free": {
"type": "long"
},
"used": {
"properties": {
"bytes": {
"type": "long"
},
"pct": {
"type": "float"
}
}
}
}
},
"free": {
"type": "long"
},
"swap": {
"properties": {
"free": {
"type": "long"
},
"total": {
"type": "long"
},
"used": {
"properties": {
"bytes": {
"type": "long"
},
"pct": {
"type": "float"
}
}
}
}
},
"total": {
"type": "long"
},
"used": {
"properties": {
"bytes": {
"type": "long"
},
"pct": {
"type": "float"
}
}
}
}
}
}
},
"type": {
"type": "text",
"fields": {
"keyword": {
"type": "keyword",
"ignore_above": 256
}
}
}
}
}
}
}
Pls guide me next what should i do
A help would be really appreciated.
Regards
Shrikant
From what I can see you are using metricbeat data for this. There is no way to do a pie chart with the way the data is reported/structured in metricbeat as it is set up to display the evolution over time of the data.
You can have something like this, which is alreadu part of the Metricbeat sample dashboards ( https://www.elastic.co/guide/en/beats/metricbeat/current/metricbeat-sample-dashboards.html ) :

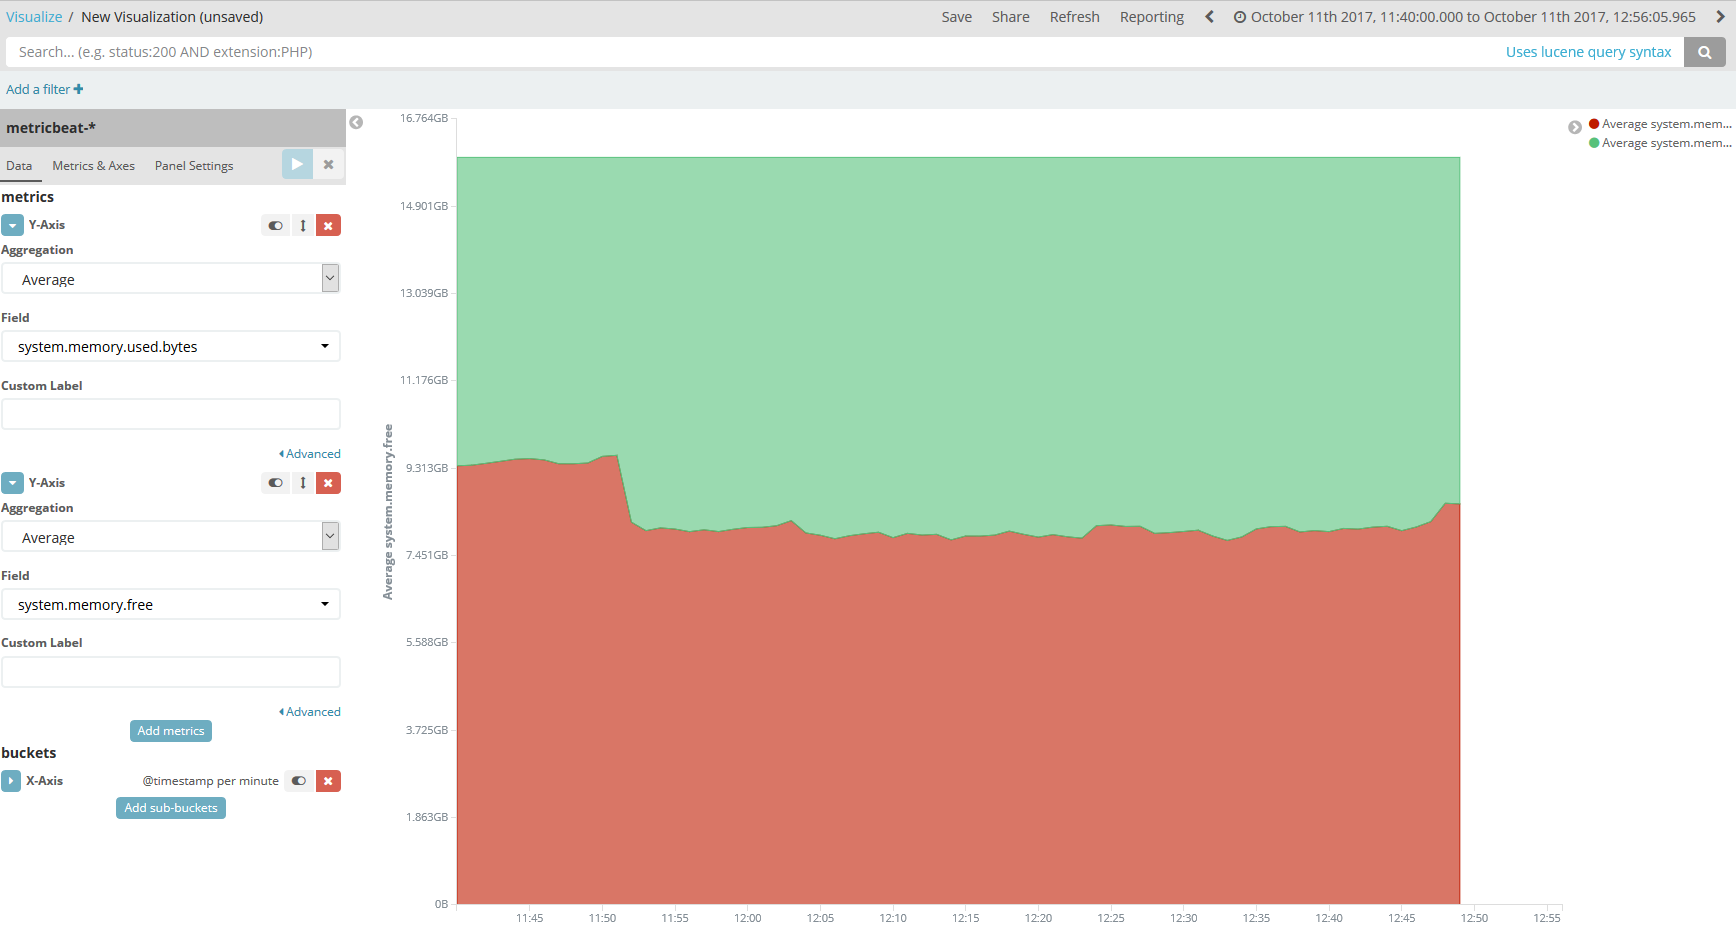
Or, if you want something more visual you can get very nice results using an Area Chart with 2 stacked metrics (average of memory.free and average of memory.used)
You can see this in the screenshot below.