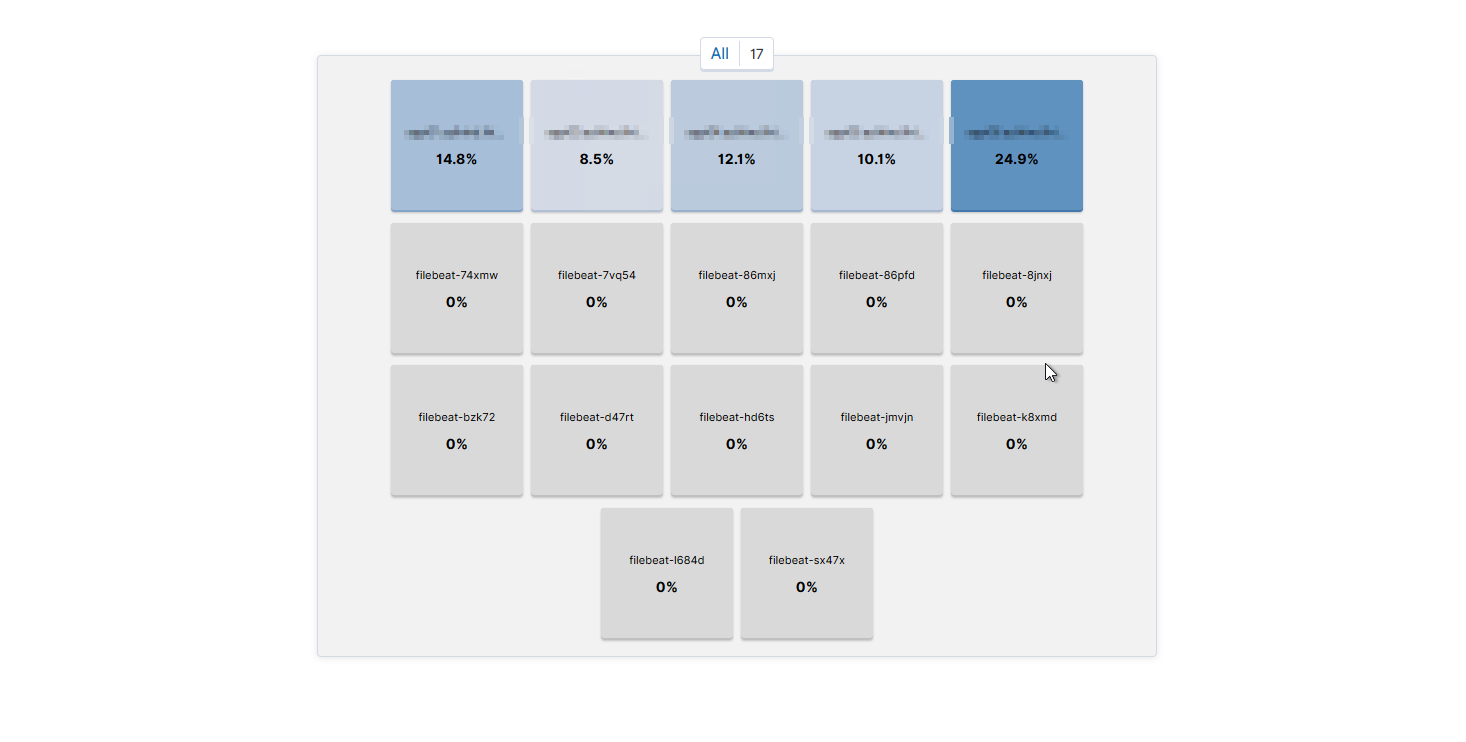
Now after avoiding the timeout I manage to load the view (very long loading time) and the difference is now that all of the filebeats agents of the cluster appear as hosts too:
Filebeat events have also host.name. Looks like this is why it is considered as host in the metrics view (even though in the settings the pattern is defined like metricbeat-*) Why is that happening? Maybe it leads to very long loading time? How I can remove the filebeats from the host metrics overview?
Edit:
After I have changed the Index Pattern in the "Logs" settings to some index, which does not contain host.name the "Metrics" Pugin loads very quickly and shows all nodes as expected, but of course I am not able anymore to "dive" into the nodes logs for example.
@Kosodrom asked around the team and it would appear that in 7.6, we loaded filebeat nodes on the inventory screen by design. For performance reasons (as you've noted), we no longer do that. In the latest releases, we respect the index pattern defined on the settings tab and only load host for that index pattern.
Apache, Apache Lucene, Apache Hadoop, Hadoop, HDFS and the yellow elephant
logo are trademarks of the
Apache Software Foundation
in the United States and/or other countries.


 What version of metricbeat and filebeat are you running?