hello dear community
i'm monitoring my cluster using self monitoring but I want to move to monitor my cluster with elastic agent instead
my configuration:
in every elasticsearch nodes I have
xpack.monitoring.collection.enabled: true
my kibana:
xpack.monitoring.enabled: true
xpack.monitoring.ui.enabled: true
xpack.monitoring.elasticsearch.hosts: ["https://192.168.1.15:9200","https://192.168.1.16:9200","https://192.168.1.14:9200"]
I installed in every node and in my kibana instance the elastic agent and all of them are enrolled in fleet under the same policy ( elasticsearch_clusterz_nodes) for elasticsearch
and kibana instances for kibana
my data stream indicate that the agents are sending logs correctly
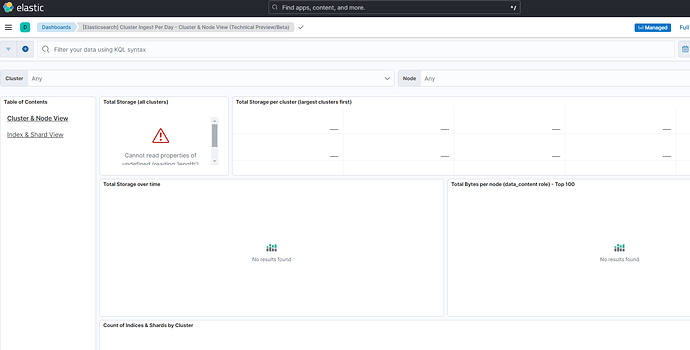
my problem is that when I go to the assets of elasticsearch integration to view the information of the cluster in general I get this
how can I solve this issue please ?


